 English
  Русский
 Bahasa Indonesia
 Bahasa Malay
 ไทย
ไทย Español
 Deutsch
 Български
 Français
 Tiếng Việt
 中文
中文 বাংলা
বাংলা हिन्दी
 Čeština
 Українська
 Română

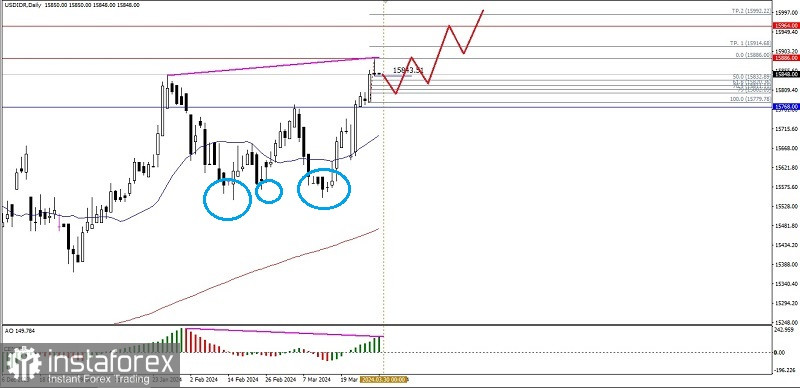
If we look at the daily chart, the exotic currency pair USD/IDR is still moving in a bullish condition. This is clearly visible from the price movement which is still moving above the MA 20 & MA 200, coupled with the appearance of the Triple Bottom pattern, which further confirms the strengthening condition of the USD currency against the Garuda currency. increasingly under pressure where currently level 15886 will be the target that will be tested and if this level is successfully penetrated upwards then the next level that will be aimed at is 15914.68 as the main target and if momentum and volatility support then level 15964 will be the next target but with the appearance of deviations between movements The price of USD/IDR with the Awesome Oscillator indicator seems to indicate that there will be a correction in the next few days, but as long as the correction does not fall below the level of 15779.78, the USD will still strengthen and win against the Rupiah currency in the next few days.
(Discalimer)