 English
  Русский
 Bahasa Indonesia
 Bahasa Malay
 ไทย
ไทย Español
 Deutsch
 Български
 Français
 Tiếng Việt
 中文
中文 বাংলা
বাংলা हिन्दी
 Čeština
 Українська
 Română

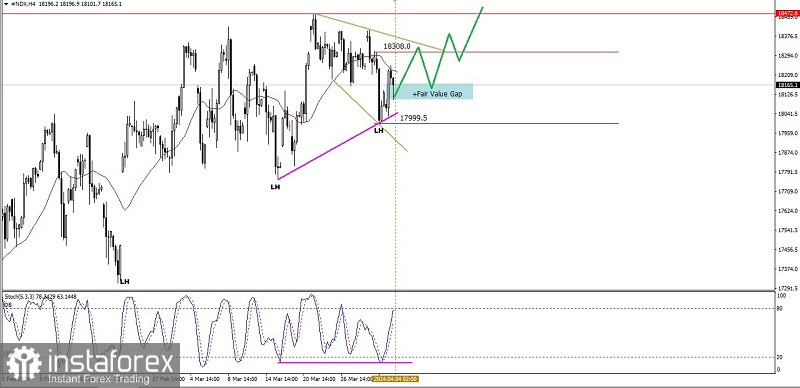
If we look at the 4-hour chart of the Nasdaq 100 index, it can be seen that Buyers still dominate, which can be seen from the price movement which formed a Lower High (LH) several times and is supported by the appearance of hidden deviations between #NDX price movements and the Stochastic Oscillator indicator and the appearance of the Descending Broadening Wedge pattern, even if the price movement is below WMA 30 Shift 2, which also happens to have a downward slope, this indicates that currently a weakening correction is occurring and as long as the correction does not breaks below the 17999.5 level, #NDX still has the potential to continue strengthening up to the 18308.0 level as the main target and level 18472.8 as the next target to be aimed at if momentum and volatility support it.
(Disclaimer)