 English
  Русский
 Bahasa Indonesia
 Bahasa Malay
 ไทย
ไทย Español
 Deutsch
 Български
 Français
 Tiếng Việt
 中文
中文 বাংলা
বাংলা हिन्दी
 Čeština
 Українська
 Română

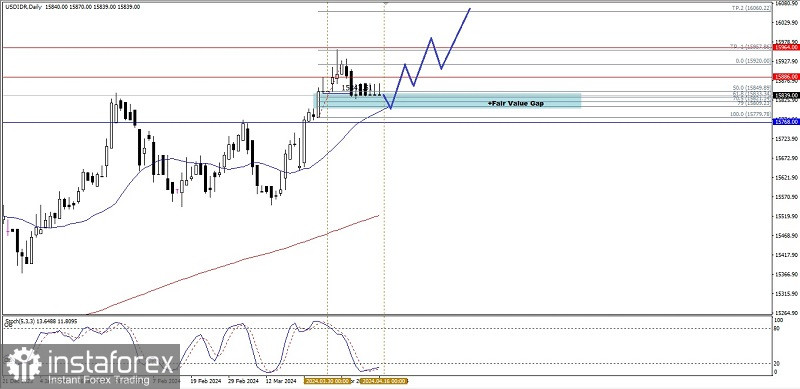
If you look at the daily chart, the exotic currency pair USD/IDR appears to be moving above its 200 MA and the Stochastic indicator which is already at the oversold level and is stuck at the level of the Bullish Fair Value Gap area which acts like a level. The support area which is quite strong seems to be holding back the rate of strengthening of the Garuda currency against the Greenback so that in the next few days as long as the strengthening correction that occurs in USD/IDR does not penetrate below the level of 15779.78, the Rupiah currency will weaken again against the USD to the level of 15964 as the main target and if momentum and volatility support then level 16060.22 is not impossible to achieve.
(Disclaimer)