English
  Русский
 Bahasa Indonesia
 Bahasa Malay
 ไทย
ไทย Español
 Deutsch
 Български
 Français
 Tiếng Việt
 中文
中文 বাংলা
বাংলা हिन्दी
 Čeština
 Українська
 Română

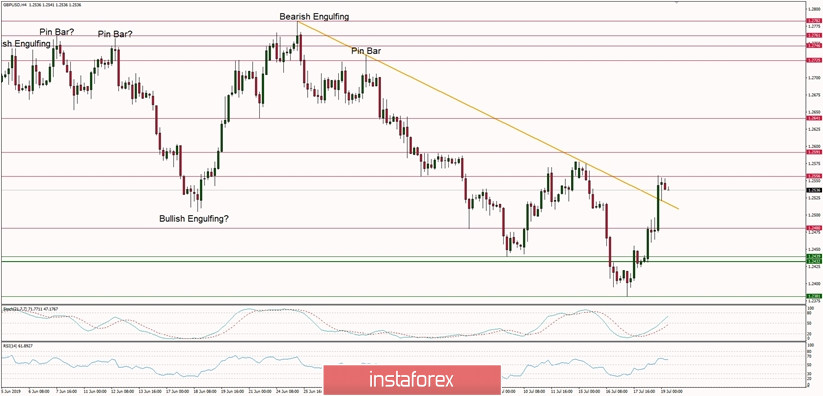
Technical Market Overview:
The GBP/USD pair has bounced strongly from the technical support at the level of 1.2381 and the bulls have even broken through the descending trendline resistance located at the level of 1.2525. The local high was made at the level of 1.2556 which is a technical resistance level. The corrective rally might last a while as the momentum is now positive and the market conditions are now off the oversold territory. The next target for bulls is seen at the level of 1.2591.
Weekly Pivot Points:
WR3 - 12770
WR2 - 1.2670
WR1 - 1.2630
Weekly Pivot - 1.2528
WS1 - 1.2496
WS2 - 1.2396
WS3 - 1.2356
Trading recommendations:
The best strategy for the current market conditions is to follow the larger timeframe trend. The larger time frame trend is still down and there are no signs of any trend reversal. The key long-term technical support at the level of 1.2420 has been violated and the next target for bears is seen at the level of 1.1983.