 English
  Русский
 Bahasa Indonesia
 Bahasa Malay
 ไทย
ไทย Español
 Deutsch
 Български
 Français
 Tiếng Việt
 中文
中文 বাংলা
বাংলা हिन्दी
 Čeština
 Українська
 Română

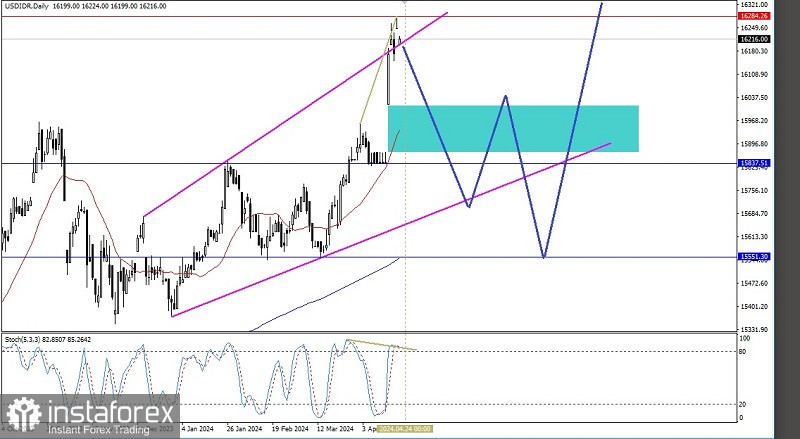
Based on the daily chart of the exotic currency pair USD/IDR, there is potential for correction of the weakening of the United States Dollar against the Garuda currency (Rupiah) as indicated by the appearance of the Ascending Broadening Wedge pattern and deviations between price movements on the chart and the Stochastic Oscillator indicator so that it is based on facts This exotic currency pair USD/IDR has the potential to close the gap below it in the next few days, where as long as there is no continuous strengthening again until it breaks above the level of 16284.16 then USD/IDR has the opportunity to go to level 15837.51 as the main target and if the momentum and volatility supports then level 15551.30 will be the next target to aim for.
(Disclaimer)