 English
  Русский
 Bahasa Indonesia
 Bahasa Malay
 ไทย
ไทย Español
 Deutsch
 Български
 Français
 Tiếng Việt
 中文
中文 বাংলা
বাংলা हिन्दी
 Čeština
 Українська
 Română

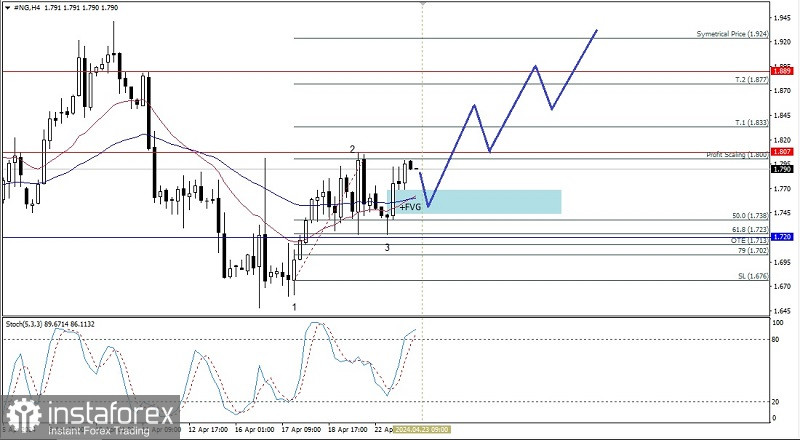
From what we see on the 4-hour chart, the Natural Gas commodity asset shows a Bullish 123 pattern, the level of the Bullish Fair Value Gap area and the intersection of the Golden Cross between MA 20 and 50, which indicates that Buyers are quite dominant at the moment so as long as there is no significant correction makes #NG weaken until it falls below level 1,676, then #NG has the potential to appreciate upwards to level 1,833 as the main target and if the momentum and volatility are good enough then it is possible that level 1,924 will be the next target to be aimed at.
(Disclaimer)