 English
  Русский
 Bahasa Indonesia
 Bahasa Malay
 ไทย
ไทย Español
 Deutsch
 Български
 Français
 Tiếng Việt
 中文
中文 বাংলা
বাংলা हिन्दी
 Čeština
 Українська
 Română

Weekly view:
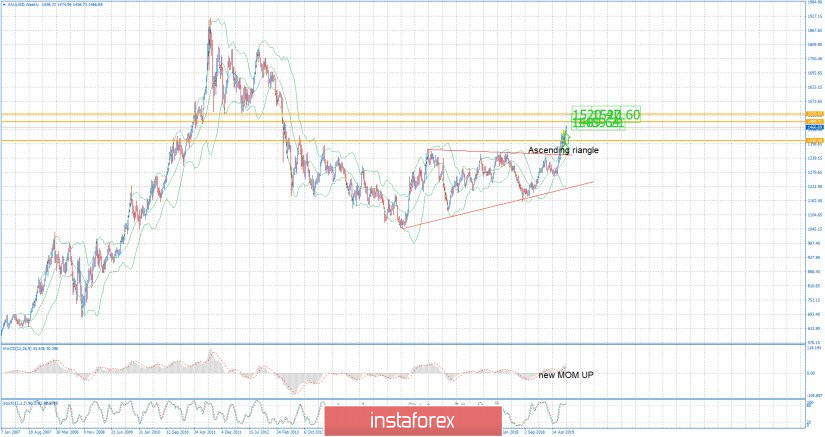
As I mentioned yesterday, there is the upside breakout of the 6-week trading range and new momentum on the MACD oscillator, which is sign for me that buying pressure is very strong. I found important resistance levels based on the price action on the Weekly chart at the price of $1.490 and $1.520 (orange horizontal lines). Conclusion based on the Weekly chart is that long term money became active and that bullish movement on lower frames got support from long term money.
4H time-frame view:
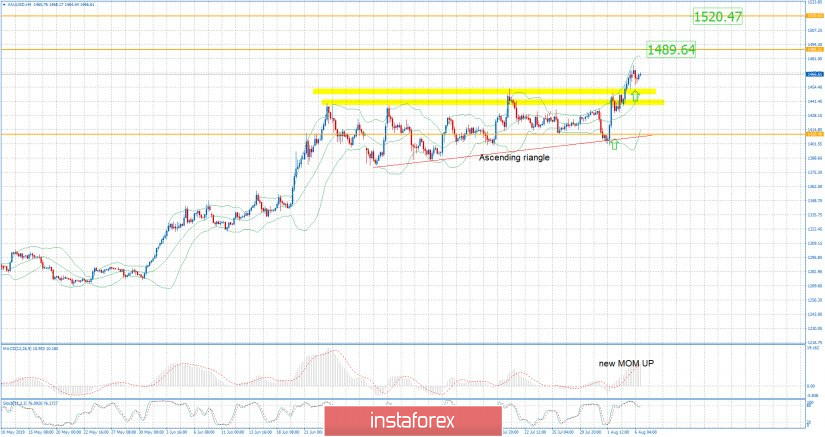
Based on the 4H time-frame, I found new momentum up on the MACD oscillator, which is sign of the underlying bullish pressure. I also found broken Ascending triangle in the background, which is another sign of the strength. Important support levels and good levels to load long positions are set at $1.452 and $1.450.
Trading recommendation:
According to current market condition and strong upward trend in the background, my advice is to watch for buying opportunities on the dips with the first target at the price of $1.489.