EURUSD bounced towards 1.12-1.1230 but got rejected. Price has pulled back below 1.11 and bears back in control of the short-term trend. Price got rejected again right at the tenkan- and kijun-sen indicators confirming bearish trend.
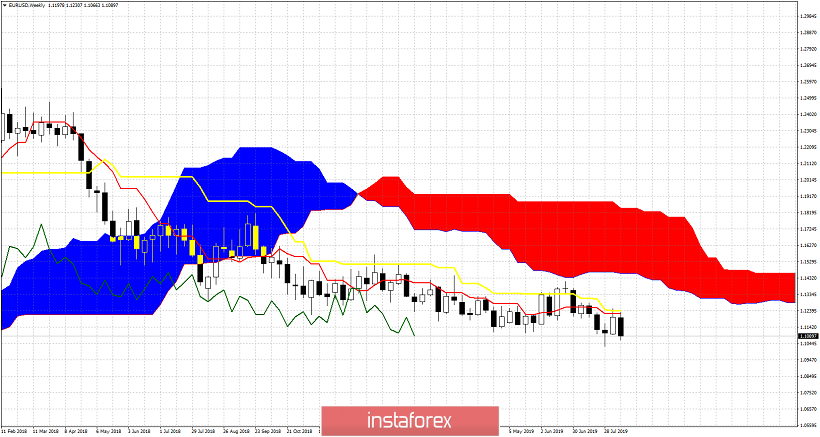
EURUSD remains in weekly bearish trend as shown by the weekly chart above. Price is not only below the weekly Kumo, but also below both the tenkan- and kijun-sen indicators (red and yellow line). The kijun-sen(yellow line indicator) is also above the tenkan-sen (Red line indicator). This confirms bearish trend. Last week and this current week bulls tried to break above the two indicators which are found at 1.120-1.1237 but both times we saw a rejection. A new lower low below 1.1026 is very possible this week. On a daily and weekly basis we have some bullish divergence signs by the RSI, but as long as price keeps making lower lows and lower highs we can not talk about a reversal.
*The market analysis posted here is meant to increase your awareness, but not to give instructions to make a trade
 English
  Русский
 Bahasa Indonesia
 Bahasa Malay
 ไทย
ไทย Español
 Deutsch
 Български
 Français
 Tiếng Việt
 中文
中文 বাংলা
বাংলা हिन्दी
 Čeština
 Українська
 Română
 Long-term review