English
  Русский
 Bahasa Indonesia
 Bahasa Malay
 ไทย
ไทย Español
 Deutsch
 Български
 Français
 Tiếng Việt
 中文
中文 বাংলা
বাংলা हिन्दी
 Čeština
 Українська
 Română

Technical market overview:
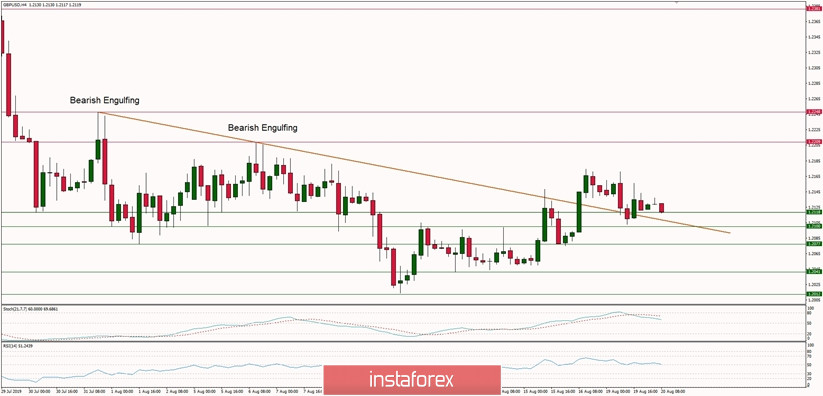
The GBP/USD pair has broken through the descending trendline resistance around the level of 1.2130 and made a new local high at the level of 1.2175. Since then, the price pulled-back a little in order to test the trendline breakout around the level of 1.2130 again. The move-up is not very fast and sudden, but step by step the bulls are continuing to cover the higher ground. The next target for them is located at the level of 1.2209 and then at 1.2248. The positive and strong momentum supports the short-term bullish outlook towards these levels.
Weekly Pivot Points:
WR3 - 1.2378
WR2 - 1.2273
WR1 - 1.2217
Weekly Pivot Point - 1.2114
WS1 - 1.2060
WS2 - 1.1953
WS3 - 1.1902
Trading Recommendations:
The best strategy for current market conditions is to trade with the larger timeframe trend, which is down. All upward moves will be treated as local corrections in the downtrend. In order to reverse the trend from down to up, the key level for bulls is seen at 1.2429. As long as the price is trading below this level, the downtrend continues.