 English
  Русский
 Bahasa Indonesia
 Bahasa Malay
 ไทย
ไทย Español
 Deutsch
 Български
 Français
 Tiếng Việt
 中文
中文 বাংলা
বাংলা हिन्दी
 Čeština
 Українська
 Română

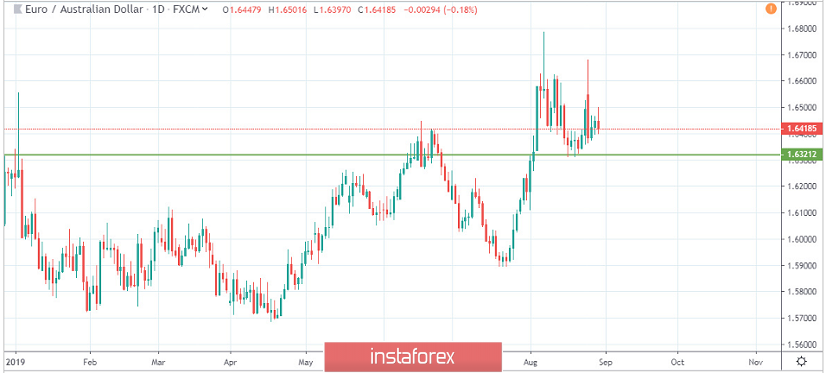
The picture shown above is the daily chart of EUR/AUD. Green line represents the resistance point on the chart. The price broke the green line in August and has been trading sideways for a month. The chart is clearly bullish even now. We see some bearish candle formation after reacting from the price of 1.67000. So traders have been taking the range trades and profiting in this manner. But things might be changing. We are no longer seeing bullish candles that makes us cautious when trying to buy EUR/AUD. The course of action for the next few days would be to wait patiently for appropriate price patterns formation and then take suitable actions. If we see a bearish candle which is able to make it to the price 1.62000, you have some potential sell trades setting up. The important point to make note of is that you require a close of the candle below our green line. Currently, there is no trade possible. If you have large risk appetite, you can also sell at the current market price (CMP). In this case, your stop loss will be above 1.66000 and target could be 1.6000. But this is a very aggressive trade. A safer approach is to sell after a bearish candle formation, which will make your stop loss to be at our green line. The target will be 1.58000. This will result in a risk to reward ratio of 1:2. For all those traders who are thinking to buy this pair, they shouldn't be buying any more.