English
  Русский
 Bahasa Indonesia
 Bahasa Malay
 ไทย
ไทย Español
 Deutsch
 Български
 Français
 Tiếng Việt
 中文
中文 বাংলা
বাংলা हिन्दी
 Čeština
 Українська
 Română

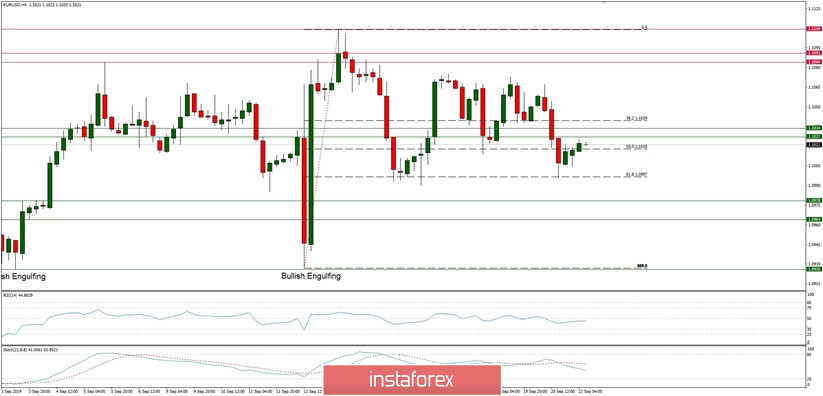
Technical Market Overview:
The EUR/USD pair is not moving in any particular direction as is got stuck in a narrow range between the levels of 1.1075 - 1.0997. The big Bullish Engulfing candlestick pattern made after the ECB decision to cut the interest rates has is still in the background and this is a powerful trend reversal pattern. Nevertheless, bulls can not find the strength to impulsively move up and are visiting the 61% Fibonacci retracement for the second time now. Any clear breakout below the level of 1.0997 will open the road towards the levels of 1.0978 and 1.0965 which are technical support levels. The key technical support is located at the level of 1.0926.
Weekly Pivot Points:
WR3 - 1.1151
WR2 - 1.1121
WR1 - 1.1056
Weekly Pivot - 1.1026
WS1 - 1.0965
WS2 - 1.0930
WS3 - 1.0867
Trading recommendations:
The best strategy for current market conditions is to trade with the larger timeframe trend, which is down. All upward moves will be treated as local corrections in the downtrend. The downtrend is valid as long as it is terminated or the level of 1.1445 clearly violated. There is an Ending Diagonal price pattern visible on the larget timeframes that indicate a possible downtrend termination soon. The key short-term levels are technical support at the level of 1.0926 and the technical resistance at the level of 1.1267.