 English
  Русский
 Bahasa Indonesia
 Bahasa Malay
 ไทย
ไทย Español
 Deutsch
 Български
 Français
 Tiếng Việt
 中文
中文 বাংলা
বাংলা हिन्दी
 Čeština
 Українська
 Română

Bitcoin continues to consolidate in a sideways movement between $7,785 and $8,700. Medium-term trend remains bearish and it seems that the more probable scenario is a break below $7.785 and a move towards $6,000-$5,500.
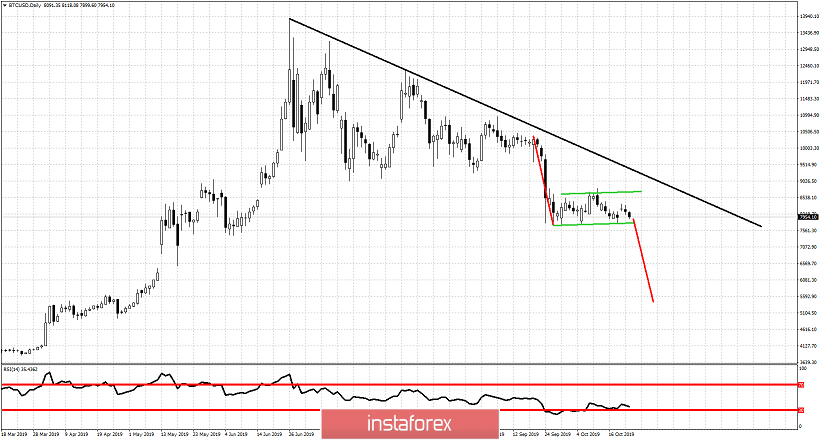
Red lines - equal size leg down
Green lines - consolidation area
BTCUSD is still inside the trading range. A break below the trading range will push prices lower. However we should be aware of the RSI if it does not produce a lower low. If the RSI produces a bullish divergence then I do not expect to see price as low as $5,500. If the RSI produces new low together with a break down, then I believe we can see $6,000-$5,500. Traders should not forget the upside break out. If price manages to break above $8,700 then we should expect price to move close to the long-term resistance trend line around $9,200-$9,500.