 English
  Русский
 Bahasa Indonesia
 Bahasa Malay
 ไทย
ไทย Español
 Deutsch
 Български
 Français
 Tiếng Việt
 中文
中文 বাংলা
বাংলা हिन्दी
 Čeština
 Українська
 Română

Bitcoin has been trading sideways at the price of 7.475 in the recent, 24 hours. I still expect more downside and potential of 6.610 in the next period but would wait for upward correction first.
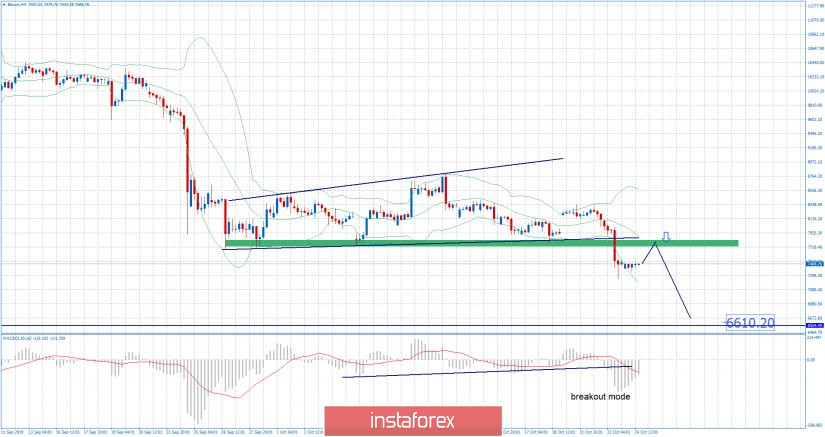
Green rectangle – Resistance and good sell zone
Blue horizontal line – Support line and downward objective
MACD is showing us strong new downside momentum in the background and I expect more downside after the bullish correction. Resistance level is found 7.780 and support level at 6.610.
Bollinger band middle line(resistance line) is set at 7.853