 English
  Русский
 Bahasa Indonesia
 Bahasa Malay
 ไทย
ไทย Español
 Deutsch
 Български
 Français
 Tiếng Việt
 中文
中文 বাংলা
বাংলা हिन्दी
 Čeština
 Українська
 Română

Gold price is still trading inside of the multi week trading range between the price of $1.518 (top of the range) and $1.461 (bottom of the range).
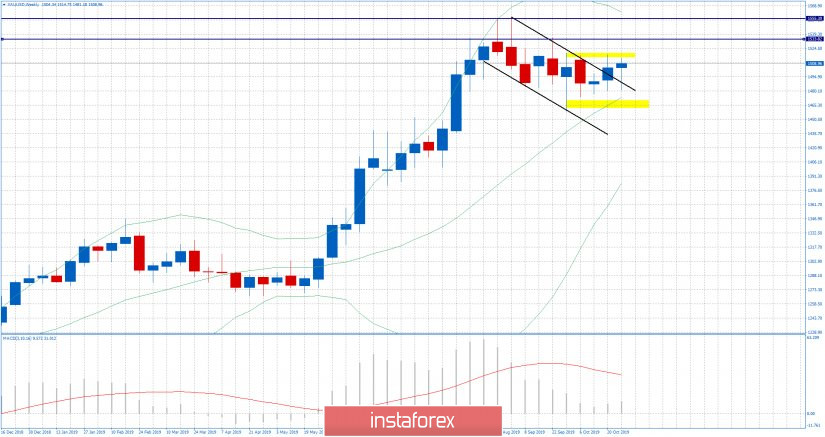
Yellow rectangles – trading range boundaries
Falling purple lines – Broken downward channel
Horizontal lines – Resistance levels
Last week I found the breakout of the downward channel (bull flag) and potential for new upward wave. Anyway, to confirm potential upside continuation on the weekly chart, I would like to see the breakout of resistance at $1.518, which will eventually lead for test of $1.533 or $1.555.
Eventual rejection of the resistance may lead the gold for rotation back into the support zone of the well defined bracket at the price of $1.475.
Middle Bollinger line is set at $1.472 and it is acting like good support zone.
Trading recommendation:
Watch for potential breakout of the multi-week bracketing zone.