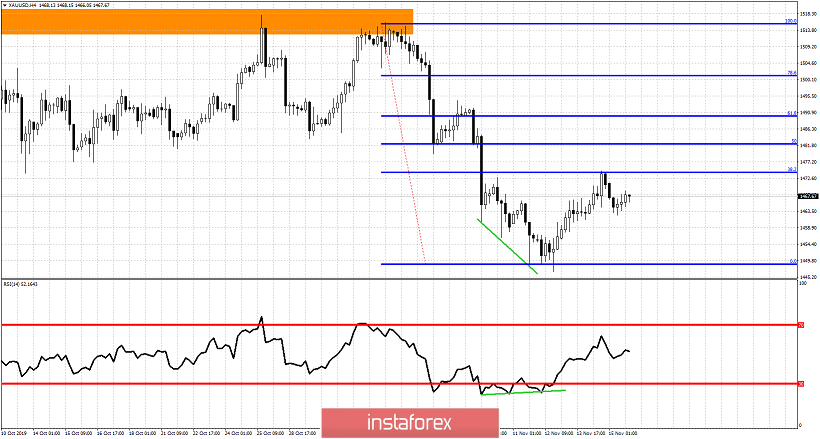
Gold price has bounced towards our first target at the 38% Fibonacci retracement after warning bears of the bullish divergence signs. This short-term relief bounce is still considered a selling opportunity as long as Gold price is below $1,525.

Green lines - bullish divergence
Gold price has stopped its rise at $1,474 where the 38% retracement of the latest leg down is found.Short-term support is found at $1,462 and next at $1,446. Resistance is found at $1,475 and if broken I expect Gold to push higher towards $1.490 which is also an important Fibonacci resistance and a previously major support level, now resistance. I believe there are a lot of chances of seeing $1,490 again.
 English
 Русский
 Bahasa Indonesia
 Bahasa Malay
 ไทย
ไทย Español
 Deutsch
 Български
 Français
 Tiếng Việt
 中文
中文 বাংলা
বাংলা हिन्दी
 Čeština
 Українська
 Română

