 English
  Русский
 Bahasa Indonesia
 Bahasa Malay
 ไทย
ไทย Español
 Deutsch
 Български
 Français
 Tiếng Việt
 中文
中文 বাংলা
বাংলা हिन्दी
 Čeština
 Українська
 Română

Hello everyone
Next days, I will start sharing posts on technical analysis and also with daily reports on all relevant market updates. That is why I am going to give you an analysis where I will show you a strategic approach for trading and investing. Let's start with the risky assets - the US stock indexes.
The SP500 rose shy of 500% (and the Nasdaq by an astonishing 680%) since the lowest levels during the Great Financial Crisis.
Let's have a look at 2019 approx gains till 15/11:
SP500: 25%
DowJones30: UP 21%
Nasdaq: UP 31%
These are incredibly high returns if you think that a long term average since 1930 is approximately not far from 10% per year.
The main drivers of this raging bull market are:
- Easy Liquidity from Central Banks (still going on)
- Price to earning expansion (on improved cost structure, technology, and low inflation)
- Corporate Buybacks (especially in the US, sowing down)
I will be back to these points in the next days: today let's have a look at some charts, starting with the NASDAQ WEEKLY one.
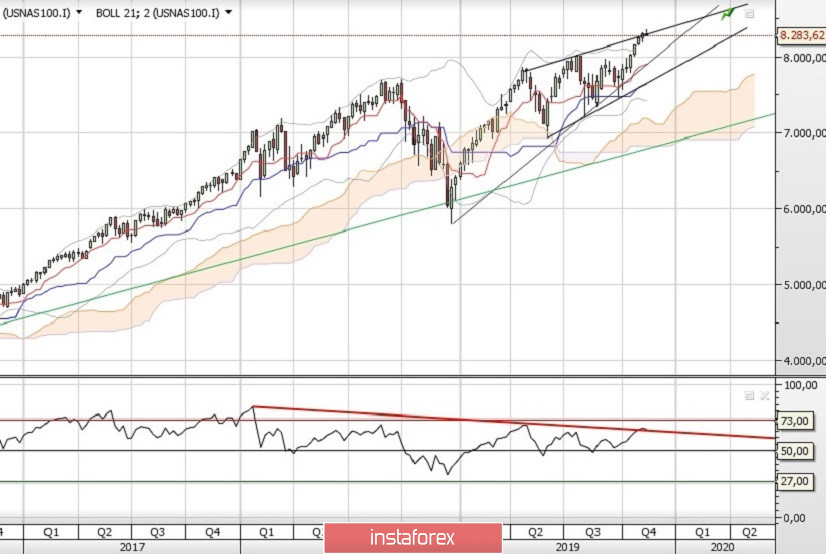
- All time Highs with the price over the upper trend of the growing wedge
- All MA positively inclined
- ADX showing a strong trend
- RSI in the overbought territory
You see this strong rise since beginning of October? You know when it started? When the US Central Bank rushed to start its NO QE program for easing the ON Repo Market (providing liquidity to big institutions)
But there will be time to go deeper on this (VERY IMPORTANT) point.
Stay Safe