 English
  Русский
 Bahasa Indonesia
 Bahasa Malay
 ไทย
ไทย Español
 Deutsch
 Български
 Français
 Tiếng Việt
 中文
中文 বাংলা
বাংলা हिन्दी
 Čeština
 Українська
 Română

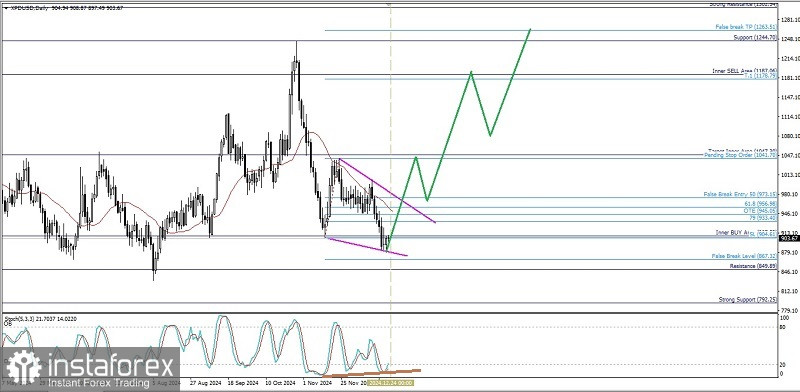
From what we can see on the daily chart of the Palladium commodity asset against the USD, it appears to be under seller pressure, this is confirmed by its price movement which is moving below the WMA (30 Shift 2) which has a downward slope, but with the appearance of the Failing Wedge pattern and the deviation between the price movement of #XPD/USD, then in the next few days as long as there is no further decline that breaks through and closes below the 867.32 level, then #XPD/USD has the potential to turn around and strengthen upwards where the 1041.70 level will be tested to be broken and close above that level if successful, then #XPD/USD will continue to strengthen to the 1178.79 and 1263.51 levels as the next targets if momentum and volatility support.
(Disclaimer)