 English
  Русский
 Bahasa Indonesia
 Bahasa Malay
 ไทย
ไทย Español
 Deutsch
 Български
 Français
 Tiếng Việt
 中文
中文 বাংলা
বাংলা हिन्दी
 Čeština
 Українська
 Română

As per our latest Elliott wave analysis of EURUSD, price has most probably completed wave C down and is now ready to resume its up trend. Price is showing reversal signs around the 61.8% Fibonacci retracement of the latest rise in price.
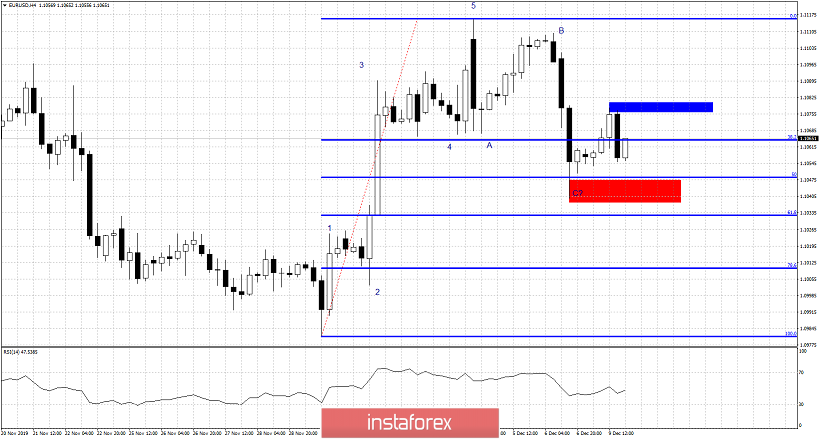
Blue rectangle - short-term resistance
EURUSD is trading above 1.1050. Price has pulled back as wave C following our analysis and we are now see a reversal effort by bulls. Support is at recent lows at 1.1039 while resistance is found at 1.1080. Breaking either level will increase the chances of the trend following the bigger direction. If the red rectangle is broken, we expect price to fall towards 1.09...On the contrary if price breaks above 1.1080, we should expect EURUSD to break above early December highs towards 1.12-1.13. This bullish wave scenario as we explained in previous posts, favors the creation of a higher low and then prices to push to new highs towards 1.12.