 English
  Русский
 Bahasa Indonesia
 Bahasa Malay
 ไทย
ไทย Español
 Deutsch
 Български
 Français
 Tiếng Việt
 中文
中文 বাংলা
বাংলা हिन्दी
 Čeština
 Українська
 Română

Last time we warned about a possible bearish reversal in USDCAD, price fell from 1.33 to 1.3160. Price since the 1.3160 low has bounced back towards 1.3270 but now we see new warning signs. Bulls need to be very careful.
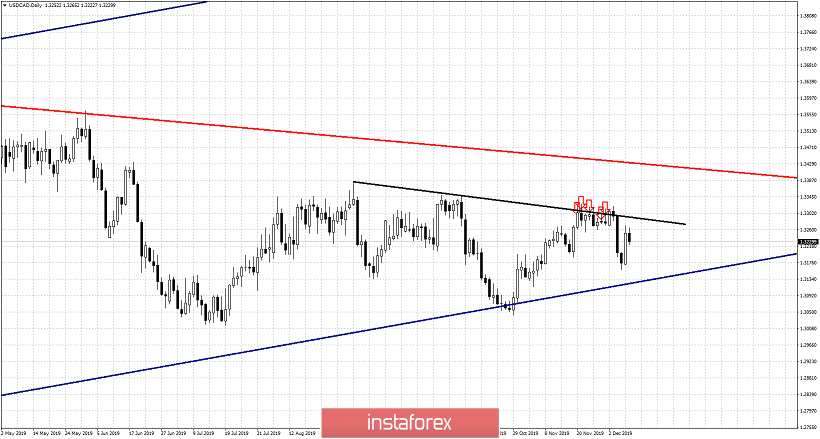
Black line -short-term resistance trend line
Red arrows - weakness signs
Blue line- long-term channel support
USDCAD is still below the black trend line resistance. As long as price is below 1.33 we remain short-term bearish looking for another test of the blue channel boundary. Short-term support is at 1.3160. If this level is broken we expect the blue channel boundary at 1.3130 to be tested. If on the other hand resistance at 1.33 is broken, we expect USDCAD to move towards 1.34 at least.