 English
  Русский
 Bahasa Indonesia
 Bahasa Malay
 ไทย
ไทย Español
 Deutsch
 Български
 Français
 Tiếng Việt
 中文
中文 বাংলা
বাংলা हिन्दी
 Čeština
 Українська
 Română

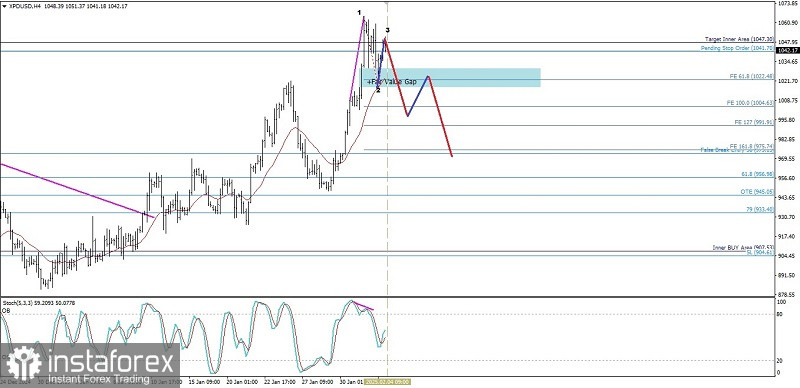
After successfully testing the 1047.30 level on its 4-hour chart, XPD/USD formed a Bearish 123 pattern followed by the appearance of Divergence between the XPD/USD price movement and the Stochastic Oscillator indicator so that based on these two facts in the near future XPD/USD has the potential to be corrected to weaken down where the 1004.63 level will be tested to be broken and close below it if successful then XPD/USD will continue its weakening back to the 991.91 - 975.74 area level but if on its way to weakening suddenly XPD/USD strengthens again to break and close above the 1065.29 level then the weakening scenario that has been described will be invalid.
(Disclaimer)