 English
  Русский
 Bahasa Indonesia
 Bahasa Malay
 ไทย
ไทย Español
 Deutsch
 Български
 Français
 Tiếng Việt
 中文
中文 বাংলা
বাংলা हिन्दी
 Čeština
 Українська
 Română

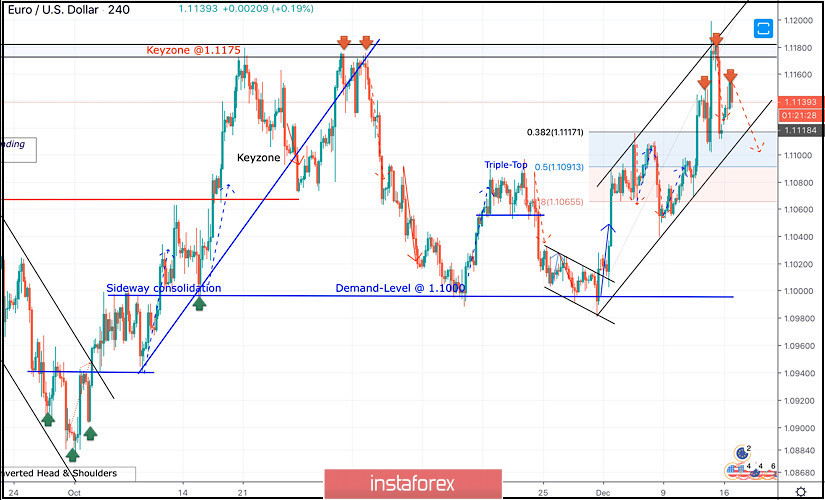
Since October 2, the EURUSD pair has been trending-up until October 21 when the pair hit the price level of 1.1175.
The price zone of (1.1175 - 1.1190) stood as a significant SUPPLY-Zone that demonstrated bearish rejection for two consecutive times in a short-period.
Hence, a long-term Double-Top pattern was demonstrated with neckline located around 1.1075-1.1090 offering valid bearish positions few weeks ago.
On the other hand, the price levels around 1.1000-1.0995 stood as significant DEMAND zone which has been offering adequate bullish SUPPORT for the pair so far.
Thus, the EUR/USD pair remained trapped between the price levels of 1.1000 and 1.1085-1.1100 (where a cluster of supply levels and a Triple-Top pattern were located) until Wednesday.
Earlier last week, considerable bullish recovery was manifested around 1.1040 allowing the current recent bullish breakout above 1.1110 to pursue towards 1.1175 within the depicted newly-established bullish channel.
Intraday bearish rejection was expected around the price levels of (1.1175). Quick bearish decline was expected towards 1.1115 (38.2% Fibonacci level).
Currently, the price level of 1.1115 stands as an Intraday demand level to be watched for price action.
Bearish breakout below 1.1080 invalidates the previous bullish scenario and activates the depicted Head & Shoulders Reversal Pattern.
If so, Bearish projection target to be located around 1.1040 and 1.1010.
Trade recommendations :
Intraday traders should wait for a bearish breakout below 1.1110 as a valid SELL signal.
Bearish projection target to be located around 1.1040 and 1.1010.