English
  Русский
 Bahasa Indonesia
 Bahasa Malay
 ไทย
ไทย Español
 Deutsch
 Български
 Français
 Tiếng Việt
 中文
中文 বাংলা
বাংলা हिन्दी
 Čeština
 Українська
 Română

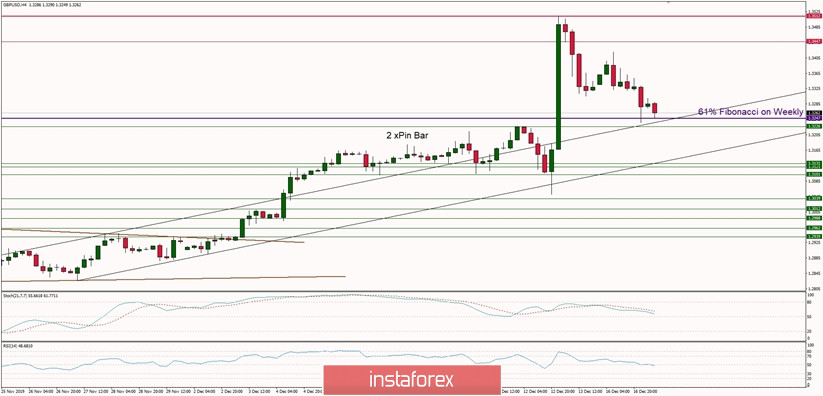
Technical Market Overview:
After making the last high on GBP/USD at the level of 1.3513 which is above 61% Fibonacci retracement of the weekly wave down (located at the level of 1.3247), the bears have managed to retrace around 50% of the last spike up and keep testing the weekly Fibonacci level. Nevertheless, the bulls still have control of the market and the next target for bulls is seen at the level of 1.3617 and 1.3667. The immediate support is seen at the level of 1.3226.
Weekly Pivot Points:
WR3 - 1.4019
WR2 - 1.3748
WR1 - 1.3564
Weekly Pivot - 1.3301
WS1 - 1.3081
WS2 - 1.2836
WS3 - 1.2626
Trading Recommendations:
The best strategy for current market conditions is to trade with the larger timeframe trend, which is up. All downward moves will be treated as local corrections in the uptrend. In order to reverse the trend from up to down, the key level for bulls is seen at 1.2756 and it must be clearly violated. The key long-term technical support is seen at the level of 1.2231 - 1.2224 and the key long-term technical resistance is located at the level of 1.3509.