 English
  Русский
 Bahasa Indonesia
 Bahasa Malay
 ไทย
ไทย Español
 Deutsch
 Български
 Français
 Tiếng Việt
 中文
中文 বাংলা
বাংলা हिन्दी
 Čeština
 Українська
 Română

The Dollar index has made no real progress for the last year as price is again where it was at the end of 2018. Price is stalling around a major Fibonacci retracement, with weakly bearish divergence signs.
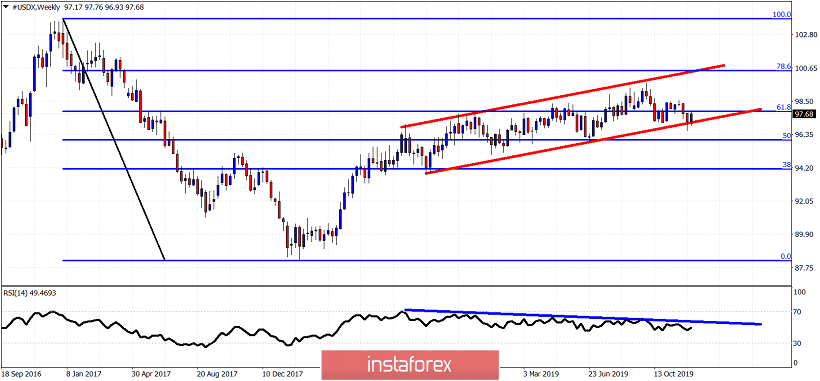
Red lines - bullish channel
Blue line - bearish divergence
The Dollar index is trading inside a bullish channel since mid 2018. Price has not broken the lower channel boundary that was recently tested. This is a sign of strength on behalf of the bulls. However we should not ignore that the RSI is diverging and we are at the major 61.8% Fibonacci retracement level. This is a potential reversal area so we need to keep a close eye on last week's lows. Holding above it will be a sign of strength for bulls. Breaking below it will be a big win for bears.