 English
  Русский
 Bahasa Indonesia
 Bahasa Malay
 ไทย
ไทย Español
 Deutsch
 Български
 Français
 Tiếng Việt
 中文
中文 বাংলা
বাংলা हिन्दी
 Čeština
 Українська
 Română

Industry news:
The first of bitcoin's spikes came after a price rally in haven markets on Friday – the day on which a US-sponsored drone attack killed Qassem Soleimani, a top Iranian military official. Investors moved into Gold, Oil, Palladium, and into any asset seen as havens in times of geopolitical tensions.
The close proximity between the price rise in traditional havens and that of bitcoin led analysts to correlate the cryptocurrency's gains with the US-Iran conflict.
Technical analysis:
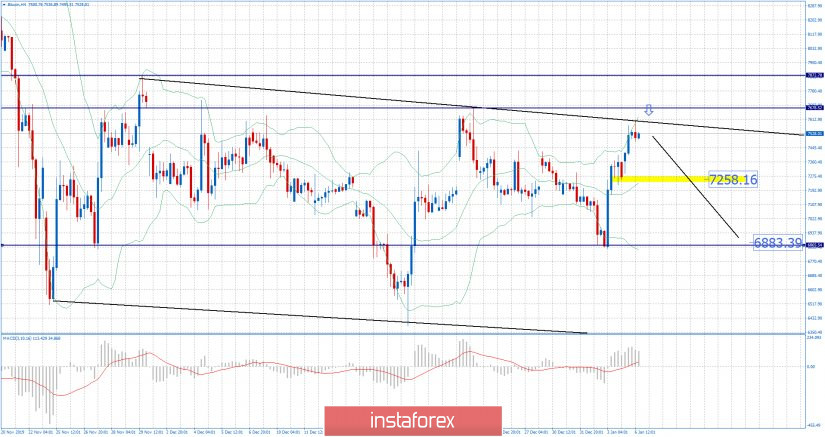
Bitcoin has been trading upside. The resistance trend line at the price of $7.600 did hold successfully, wich is sign for potential downside rotation.
MACD oscillator is showing upside momentum and with slow line that is slopping to the upside..
Yellow rectangles – Support and first downward target
Resistance levels are seen at the price of $7.600 and $7.700
Support levels are set at the price of $7.250 and at the price of $6.885