 English
  Русский
 Bahasa Indonesia
 Bahasa Malay
 ไทย
ไทย Español
 Deutsch
 Български
 Français
 Tiếng Việt
 中文
中文 বাংলা
বাংলা हिन्दी
 Čeština
 Українська
 Română

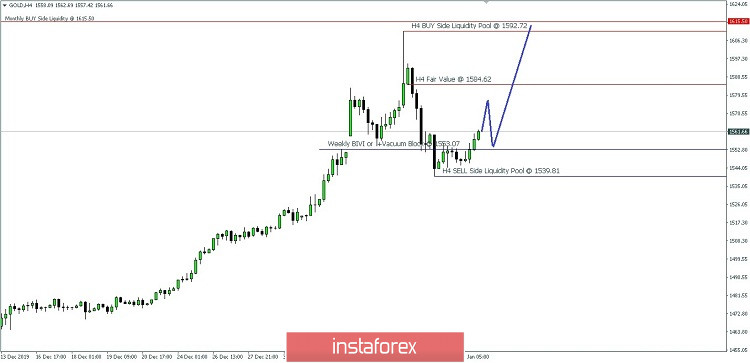
Analizing Gold seasonal trends and the COT Commercial Hedge, this commodity has been trading with the bullish bias. It seems the Gold price is going to test the 4-Hour chart fair value at 1$5,84.62. If the volatility and momentum is good, there is a possibility that gold will try to test the 4-Hour chart BUY Side Liquidity Pool at $1,592.72 and the Monthly Chart BUY Side Liquidity Pool Level at $1,615.50.
Overall, the precious metal has been following the uptrend.
* For detailed information, you can download the .pdf version from here: https://uptobox.com/6777gmdx4ncy
(Disclaimer)