GBPUSD is following our expected wave path for a move below 1.29 after bouncing towards 1.3250. Price has so far moved exactly as we predicted and this increases our hopes that a bigger reversal should follow,as this remains our key scenario for the first quarter. Price is following our analysis from December 17th.
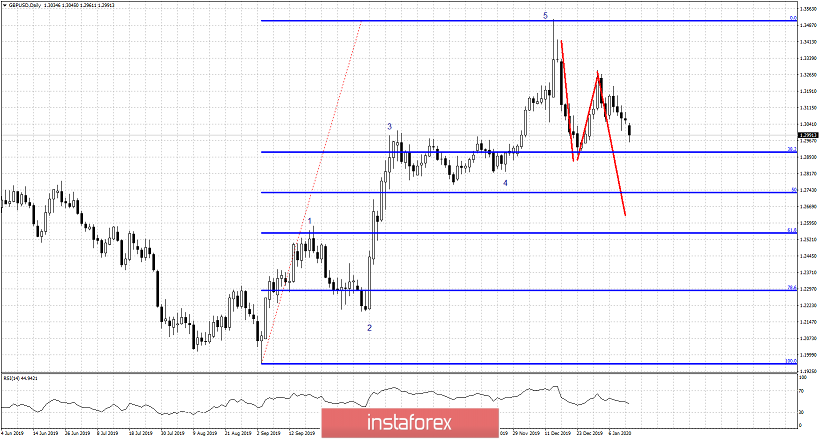
GBPUSD is trading around 1.2990 and is in bearish trend. Price is making lower lows and lower highs. Support is at the 38% Fibonacci retracement level where it bottomed on December 23rd. If this support fails to hold we should see price move towards the 61.8% Fibonacci retracement. As we said when price was trading around 1.3260, we expect a move below 1.29 at minimum. Ideal wave C down should complete around the 1.26-1.25 area. Resistance is at 1.3215 and as long as we trade below it, we remain bearish.
*The market analysis posted here is meant to increase your awareness, but not to give instructions to make a trade
 English
  Русский
 Bahasa Indonesia
 Bahasa Malay
 ไทย
ไทย Español
 Deutsch
 Български
 Français
 Tiếng Việt
 中文
中文 বাংলা
বাংলা हिन्दी
 Čeština
 Українська
 Română
