 English
  Русский
 Bahasa Indonesia
 Bahasa Malay
 ไทย
ไทย Español
 Deutsch
 Български
 Français
 Tiếng Việt
 中文
中文 বাংলা
বাংলা हिन्दी
 Čeština
 Українська
 Română

Today we take a zoomed out look at the chart of USDJPY. This pair is now at a very important long-term pivot point. We are challenging the broken long-term triangle pattern from below. Bulls need to be very cautious at current levels as the chances of a rejection are high.
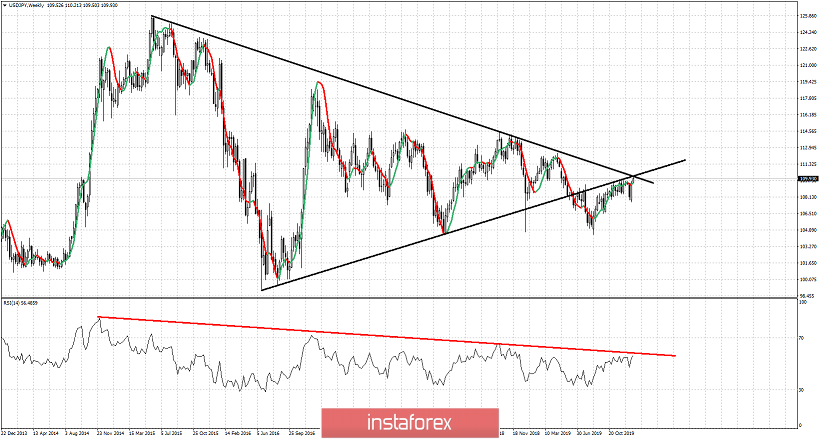
Red line - RSI resistance
The weekly chart of USDJPY provides us with two clear messages. The 110 price level is very important resistance. The RSI confirms this as its price is also challenging the red resistance trend line. Secondly, challenging the broken triangle from below is a common back test pattern after triangle breakouts. A rejection here is very probable as price has shown bearish divergence signs in the last few weeks. Either way the market will dictate to us what should follow the coming months. Inability to break above 110 and staying below it will push price back to 104-105 at least. Recapturing 110 and continuing to make higher highs and higher lows will open the way for 115-116. At the current levels I prefer to be bearish as the risk reward favors the bearish side.