 English
  Русский
 Bahasa Indonesia
 Bahasa Malay
 ไทย
ไทย Español
 Deutsch
 Български
 Français
 Tiếng Việt
 中文
中文 বাংলা
বাংলা हिन्दी
 Čeština
 Українська
 Română

Overview:
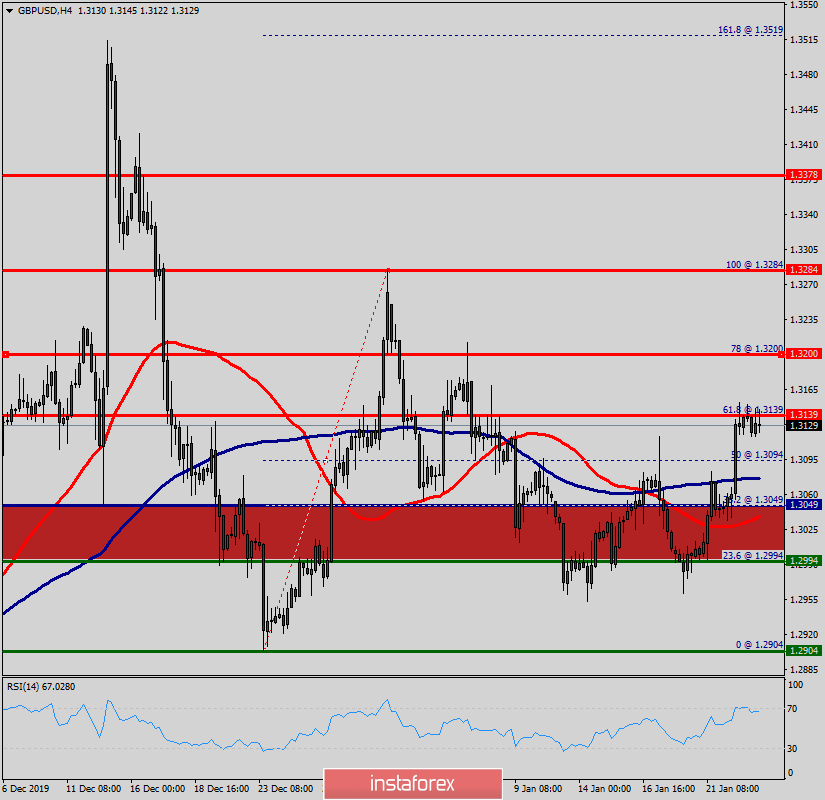
The resistance of GBP/USD pair has broken; it turned to support around the daily pivot point of 1.3049. Thereby, forming a strong support at 1.3049.
The level of 1.3049 coincides with the ratio of 38.2% Fibonacci retracement which is acting as major support today.
The Relative Strength Index (RSI) is considered overbought because it is above 30. At the same time, the RSI is still signaling an upward trend, as the trend is still showing strong above the moving average (100), this suggests the pair will probably go up in coming hours.
Accordingly, the market will probably show the signs of a bullish trend. In other words, buy orders are recommended above 1.3049 level with their first target at the level of 1.3200.
From this point, the pair is likely to begin an ascending movement to the point of 1.3200 and further to the level of 1.3284.
The price of 1.3378 will act as a strong resistance and the double top has already set at the point of 1.3378.
On the other hand, if a break happens at the support of 1.2904, then this scenario may become invalidated. But in overall, we still prefer the bullish scenario.