 English
  Русский
 Bahasa Indonesia
 Bahasa Malay
 ไทย
ไทย Español
 Deutsch
 Български
 Français
 Tiếng Việt
 中文
中文 বাংলা
বাংলা हिन्दी
 Čeština
 Українська
 Română

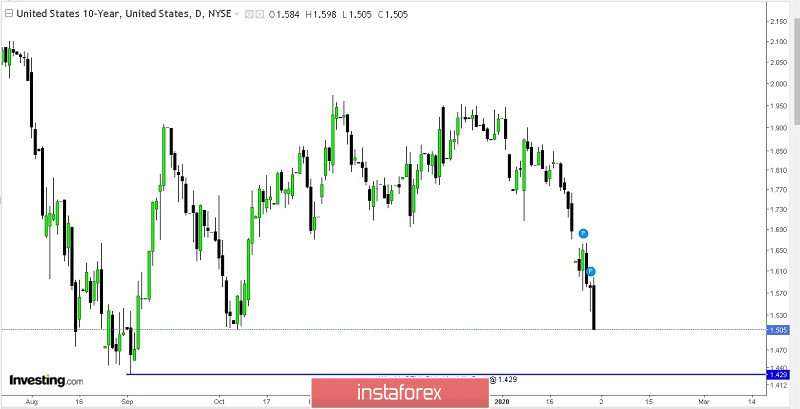
Source: investing.com
The 10 Year US Treasury is unlikely to reach the weekly sell side liquidity pool at 1.429 level. If Treasury Yields will increase, the US dollar Index usually declines.
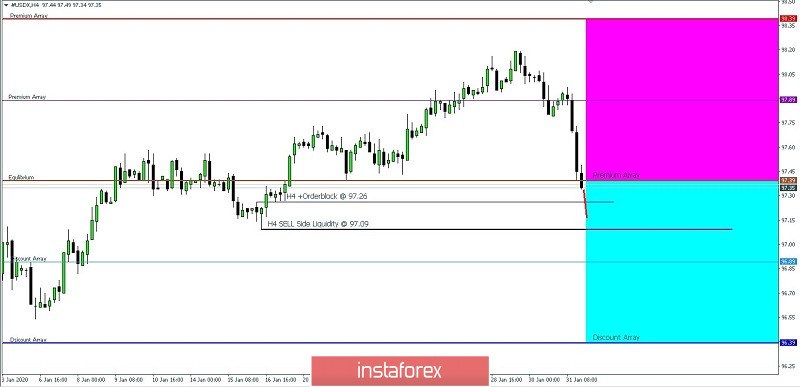
Source: Instatrader 4
In the first week of February, the US dollar is likely to dip. It may also trade sideways during this month. This week, the 4 hour chart order block advanced to 97.26 and the 4 hour chart sell side liquidity pool came in at 97.09. For more details, you can download the report from here.
(Disclaimer)