 English
  Русский
 Bahasa Indonesia
 Bahasa Malay
 ไทย
ไทย Español
 Deutsch
 Български
 Français
 Tiếng Việt
 中文
中文 বাংলা
বাংলা हिन्दी
 Čeština
 Українська
 Română
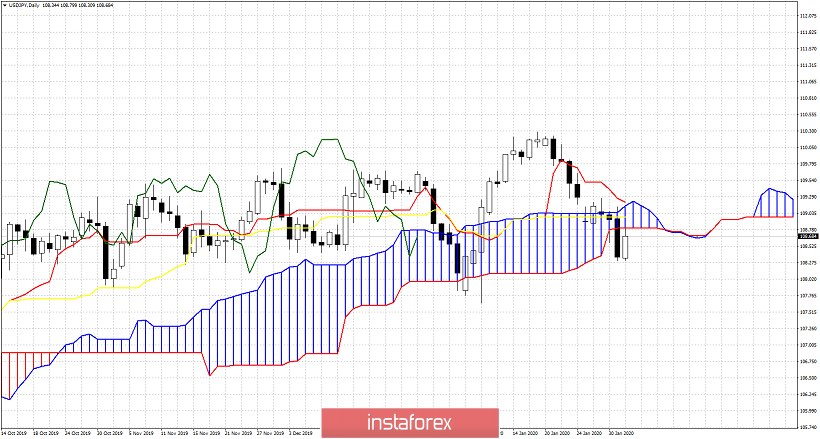
USDJPY has provided us with another bearish signal in the Daily chart by breaking below the Daily Kumo. Price is now bouncing again towards the Kumo and it is important to see if price gets rejected or re-enters the cloud.
 Relevance until
USDJPY has provided us with another bearish signal in the Daily chart by breaking below the Daily Kumo. Price is now bouncing again towards the Kumo and it is important to see if price gets rejected or re-enters the cloud.