 English
  Русский
 Bahasa Indonesia
 Bahasa Malay
 ไทย
ไทย Español
 Deutsch
 Български
 Français
 Tiếng Việt
 中文
中文 বাংলা
বাংলা हिन्दी
 Čeština
 Українська
 Română

USDCAD has formed a very promising bottom formation around 1.32 and is bouncing towards 1.33 as expected. Next targets are at 1.3358 and 1.3425 as long as price is above 1.32.
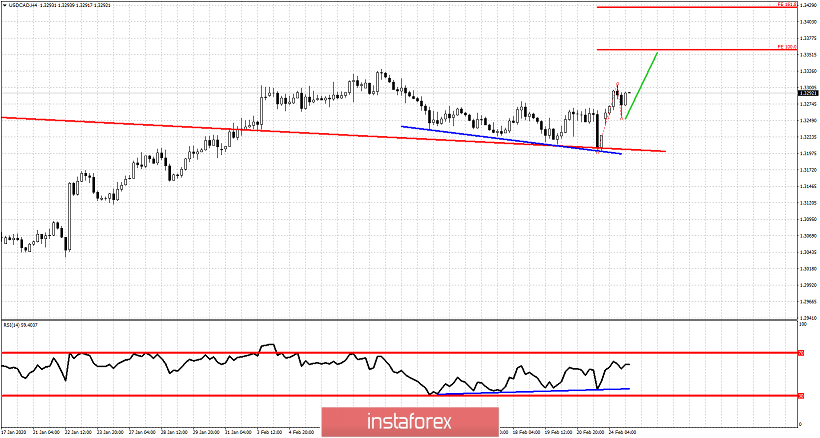
Blue line - bearish divergence
Red line - resistance (broken)
Horizontal red lines - targets
Green line - expected path
USDCAD I believe has made a meaningful bottom at 1.32 and we should expect price to continue higher above 1.33. The RSI has been making glaring bullish divergence warning signs. Price has also broken above recent lower high strengthening our bullish scenario.