 English
  Русский
 Bahasa Indonesia
 Bahasa Malay
 ไทย
ไทย Español
 Deutsch
 Български
 Français
 Tiếng Việt
 中文
中文 বাংলা
বাংলা हिन्दी
 Čeština
 Українська
 Română

In a previous analysis posted on February 25th we noted that we were given initial reversal signals in EURUSD by the Ihcimoku cloud indicator. Our first target of 1.0945 was reached and we now approach our second target of 1.11.
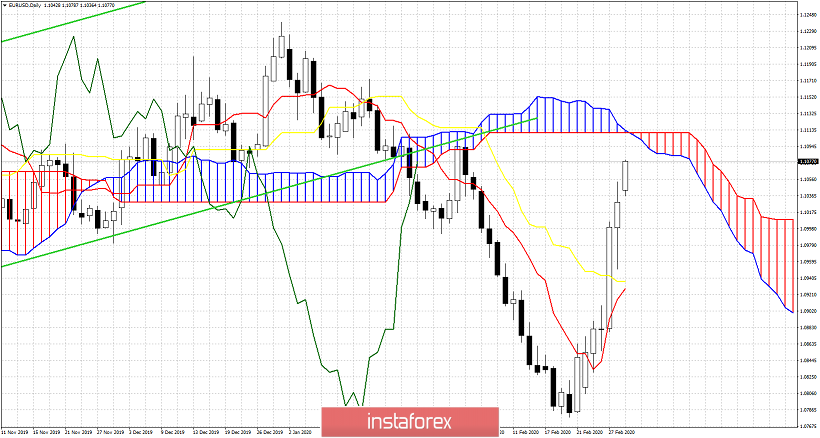
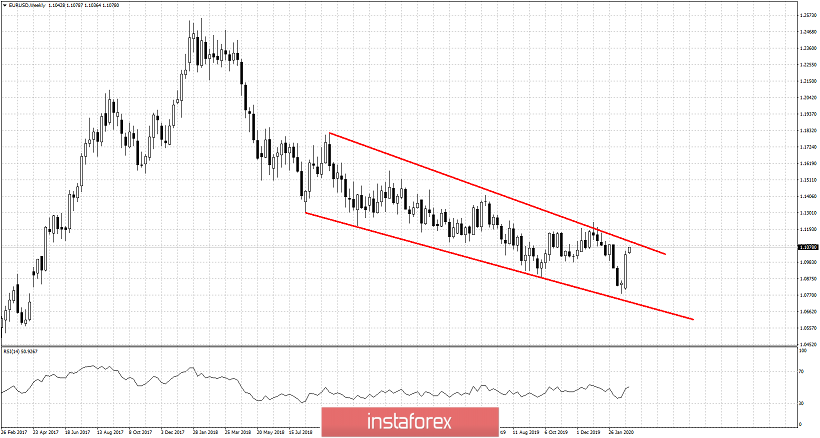
EURUSD is approaching the upper channel boundary. The Ichimoku cloud indicator also confirms that this area just ahead is important resistance area. The sentiment at the start of this week is strong, where the traders left it last week. With a weekly bullish hammer two weeks ago and a strong week that followed, will we see another strong week and a break above weekly resistance? A rejection at 1.1130-1.11 would be a bearish sign. This is not the time to buy as price is very close to important resistance.