 English
  Русский
 Bahasa Indonesia
 Bahasa Malay
 ไทย
ไทย Español
 Deutsch
 Български
 Français
 Tiếng Việt
 中文
中文 বাংলা
বাংলা हिन्दी
 Čeština
 Українська
 Română

Gold price has broken through $1,500 and is now trading around the October 2019 levels where the latest rally started. Gold price in Ichimoku cloud terms remains in a weekly bullish trend, but in previous posts we have shown the warning signals and the indications of a pull back towards $1,500.
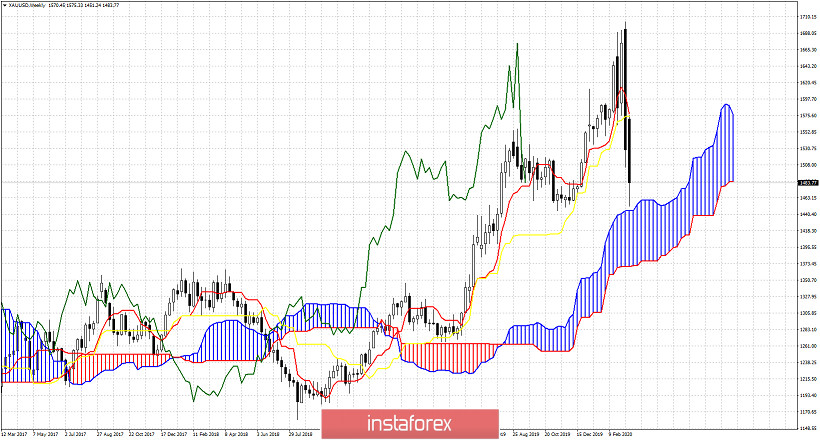
Gold price is still above the Ichimoku cloud. Price has tested the Kumo this week as price broke down sharply after last week saw prices close below both the tenkan- and kijun-sen indicators. If selling pressures continue we might see a weak sell signal where the tenkan-sen crosses below the kijun-sen. If this is combined with a break of price below the cloud or inside the cloud, that would be bearish for Gold.