English
  Русский
 Bahasa Indonesia
 Bahasa Malay
 ไทย
ไทย Español
 Deutsch
 Български
 Français
 Tiếng Việt
 中文
中文 বাংলা
বাংলা हिन्दी
 Čeština
 Українська
 Română

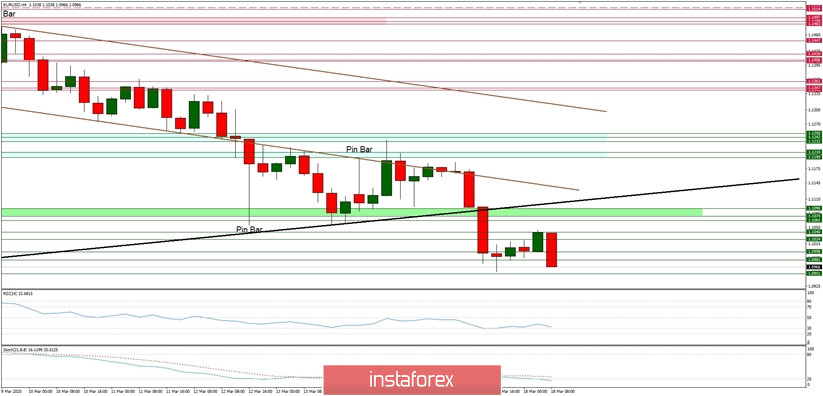
Technical Market Overview:
The EUR/USD pair has broken below the trendline support around the level of 1.1065 (marked in black), which was the additional key support holding the bearish attacks and is currently trading in a narrow horizontal range located between the levels of 1.096 - 1.1040. The market conditions are oversold on the H4 timeframe with momentum oscillating around the neutral level. The next target for bulls is seen at the level of 1.1090 and with increasing momentum on this timeframe, the odds are high. The technical support is located at the level of 1.0951 and 1.0878.
Weekly Pivot Points:
WR3 - 1.1749
WR2 - 1.1625
WR1 - 1.1316
Weekly Pivot - 1.1171
WS1 - 1.0880
WS2 - 1.0735
WS3 - 1.0438
Trading Recommendations:
The downtrend was valid as long as it was terminated or the level of 1.1445 clearly violated, so now all upward moves will not be treated as local corrections in the downtrend, but as a new uptrend. The Ending Diagonal price pattern visible on the larger timeframes like weekly has been completed and the EUR/USD is developing a new wave up.