 English
  Русский
 Bahasa Indonesia
 Bahasa Malay
 ไทย
ไทย Español
 Deutsch
 Български
 Français
 Tiếng Việt
 中文
中文 বাংলা
বাংলা हिन्दी
 Čeština
 Українська
 Română

EURUSD has bounced off 1.0638 low to 1.0880 earlier today, but price is now back at 1.08. In our previous analysis we noted that major resistance is found at 1.08-1.0830. A daily close above this area would be a bullish sign, however we need to take into consideration the possibility that the bearish trend is not over yet.
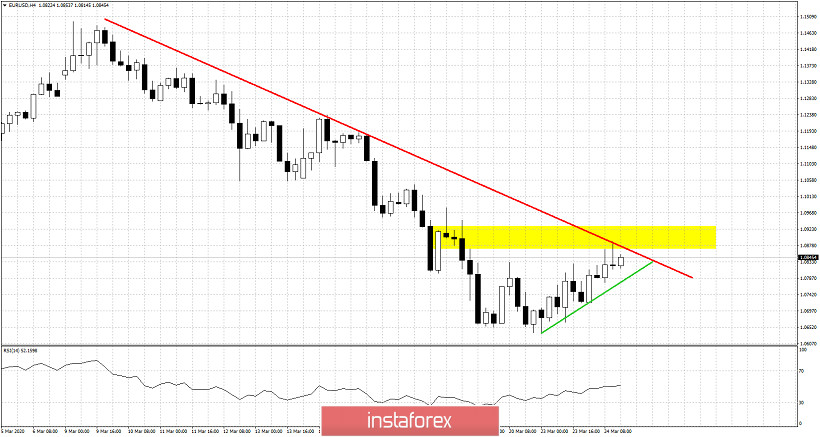
Green line - support
Yellow rectangle - resistance area
EURUSD is making higher highs and higher lows since March 20th. In the 4 hour chart shown above we see this sequence and we also see that price has reached very close to our resistance trend line and the yellow resistance area. Holding above the short-term upward sloping green line is very important for the short-term trend. This bounce could continue to 1.11 if price holds above the green line. A rejection at the red resistance trend line and a break below the green line support at 1.0770 would be a bearish sign that would increase the chances of seeing a new lower low below 1.0638. Breaking above the red resistance trend line could push price towards the next short-term resistance at 1.0960.