 English
  Русский
 Bahasa Indonesia
 Bahasa Malay
 ไทย
ไทย Español
 Deutsch
 Български
 Français
 Tiếng Việt
 中文
中文 বাংলা
বাংলা हिन्दी
 Čeština
 Українська
 Română

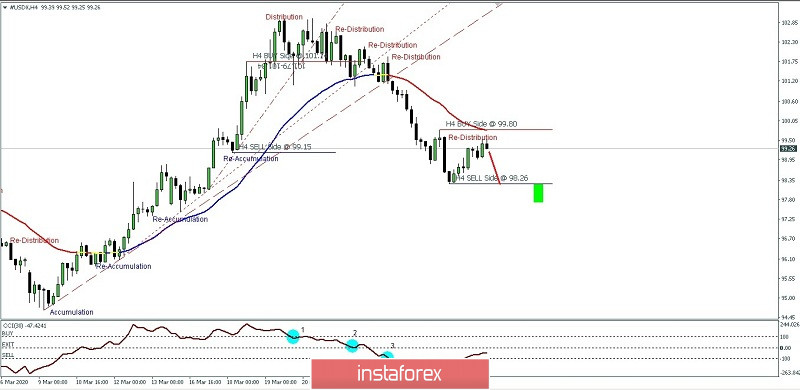
The US Dollar Index on 4 Hour Chart is now making a Market Maker Sell Model since the index has already broken out and closed below 101.08. From the technical viewpoint, since the CCI (30) has been already moving below the 100(1), 0(2), and -100(3) levels. As the price is moving below the downward slope 30-period Moving Average, we know exactly that USDX is trading under downward pressure. Now it aims to reach 98.26 as the nearest liquidity pool. As long as the index does not retrace upwards higher than 99.80, the 98.26 level is likely to be broken soon.
The overall bias of #USDX is bearish.
(Disclaimer)