 English
  Русский
 Bahasa Indonesia
 Bahasa Malay
 ไทย
ไทย Español
 Deutsch
 Български
 Français
 Tiếng Việt
 中文
中文 বাংলা
বাংলা हिन्दी
 Čeština
 Українська
 Română

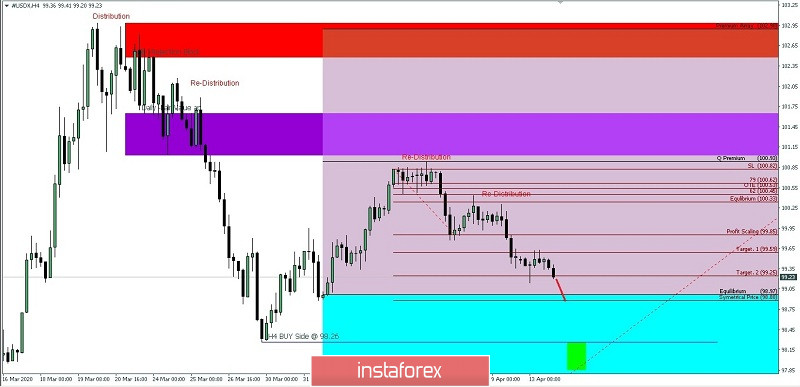
From the 4-hour chart of the USD Index, we see clearly that #USDX is now in a Premium Array Area from the Interbank Price Delivery Algorithm (IPDA) that is a 60-day trading range. It means that #USDX is poised to go down. Now the index #USDX is trying to reach the Discount Array with the first target at 98.87-98-88 levels as long as the price does not rebound above 99.63.
The overall trend for #USDX is bearish
(Disclaimer)