 English
  Русский
 Bahasa Indonesia
 Bahasa Malay
 ไทย
ไทย Español
 Deutsch
 Български
 Français
 Tiếng Việt
 中文
中文 বাংলা
বাংলা हिन्दी
 Čeština
 Українська
 Română

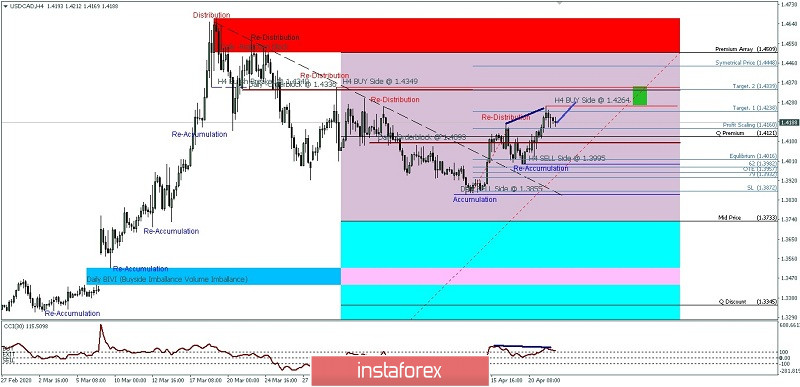
As we can see on the 4-hour chart Loonie remains now in the premium array area. it means that USD/CAD may decline. The Divergence between the CCI (30) is also indicating such a probability. During the Covid 19 outbreak the Crude Oil price plunged. The pair could reach the 1.4264-1.4275 levels before it drops again. USD/CAD is unlikely to break above 1.4349.
The overall bias for USD/CAD is bearish.
(Disclaimer)