 English
  Русский
 Bahasa Indonesia
 Bahasa Malay
 ไทย
ไทย Español
 Deutsch
 Български
 Français
 Tiếng Việt
 中文
中文 বাংলা
বাংলা हिन्दी
 Čeština
 Українська
 Română

As we explained in previous posts, I expect Gold price to make a considerable reversal soon. Recent price action suggests that price could turn back below $1,700 again soon, but we also need to take under consideration the bullish Head and Shoulders pattern that has been formed.
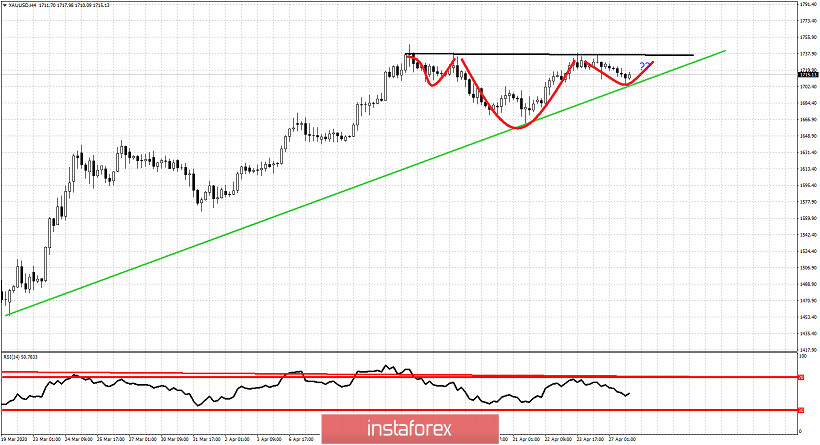
Black line - neckline resistance
Green line - long-term support trend line
Red lines - Head and Shoulders pattern
Gold price as can be seen in the chart above, has most probably formed a H&S pattern. Breaking above $1,737 should open the way for a move to new 2020 highs towards $1,790-$1,800. Support by the upward sloping trend line is important for the medium-term trend. Breaking below $1,700 would open the way for a deeper correction.
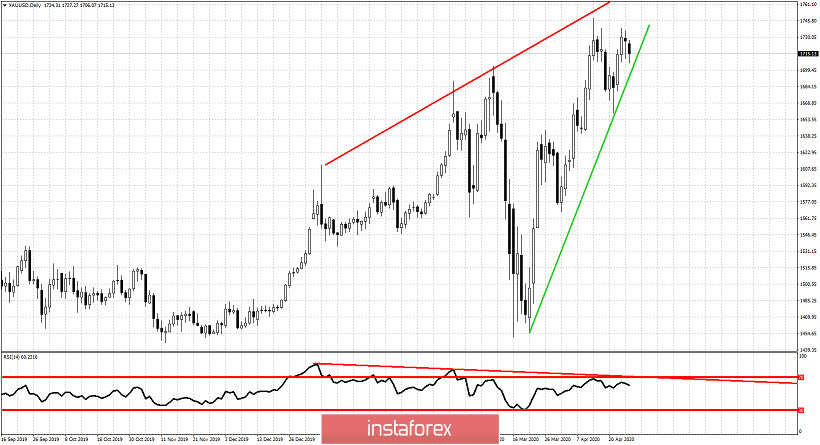
Green line -support trend line
So far trend remains bullish. I have chosen to turn neutral or bearish as I believe the upside in Gold price is limited. The RSI is diverging and once the support trend line is broken we should see a strong move lower.