English
  Русский
 Bahasa Indonesia
 Bahasa Malay
 ไทย
ไทย Español
 Deutsch
 Български
 Français
 Tiếng Việt
 中文
中文 বাংলা
বাংলা हिन्दी
 Čeština
 Українська
 Română

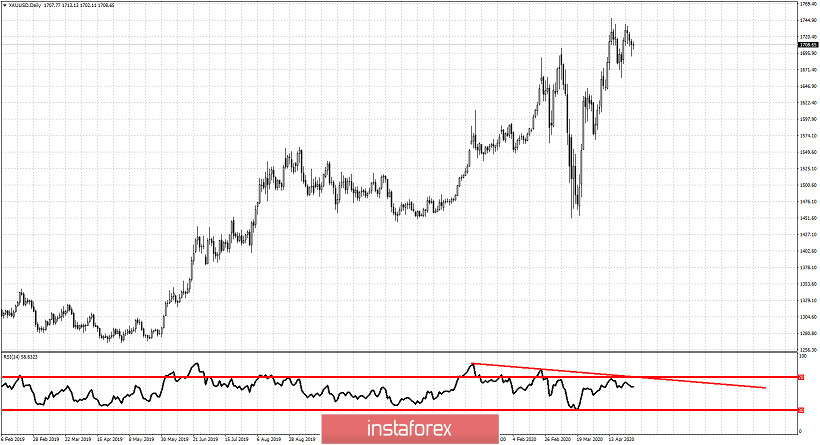
Gold price continues to move inside the trading range of $1,750 and $1,670 since mid April. Price has no clear direction. We expect to get some signals if certain support or resistance levels break. Both bullish and bearish scenarios are still open. Medium-term trend remains bullish, but we lean more on the bearish scenario.
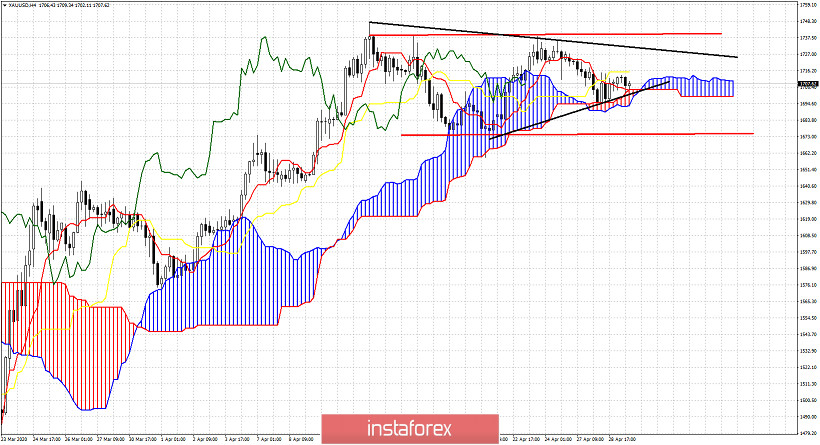
Black lines - triangle pattern
Gold price is challenging the Ichimoku cloud support. So far this support has been respected. Breaking below $1,694 will be a bearish sign according to the Ichimoku indicator. At the same time price would have broken the lower triangle boundary. Another bearish sign. If price exits the trading range then we should expect more strength towards the same direction with the break out.