 English
  Русский
 Bahasa Indonesia
 Bahasa Malay
 ไทย
ไทย Español
 Deutsch
 Български
 Français
 Tiếng Việt
 中文
中文 বাংলা
বাংলা हिन्दी
 Čeština
 Українська
 Română

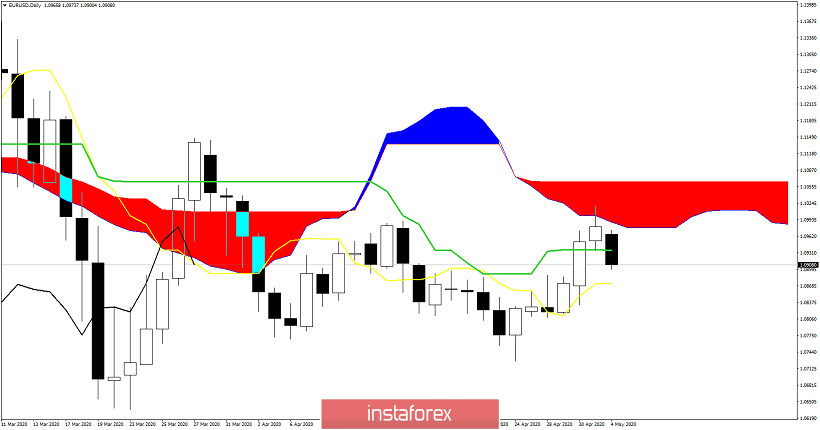
EURUSD is getting rejected at the short-term cloud resistance area. Price reached our cloud target area and is now turning back. Price shows rejection signs and if we see more weakness below 1.09, we should consider this upward move as a counter trend bounce and we should expect price to continue lower below 1.07 over the coming weeks.
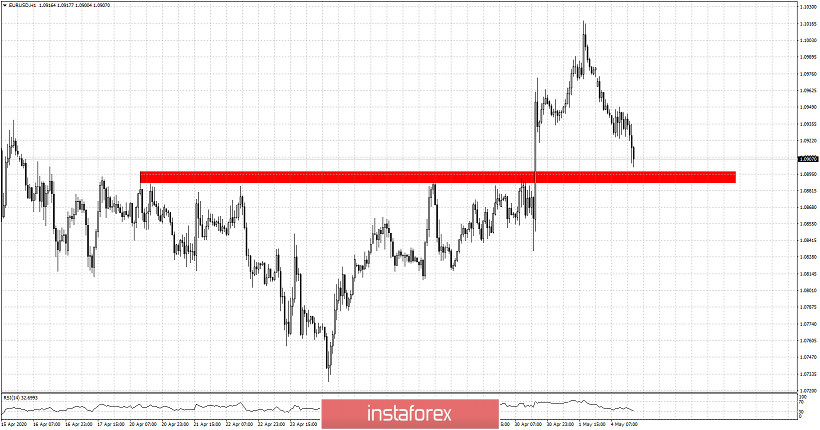
EURUSD had broken an inverted head and shoulders pattern to the upside. The neckline that was once resistance is now support. Price is now back testing the break out area. If price falls below the support area then I will take it as a bearish sign. If support area holds and price bounces, I will be expecting a move above 1.1030 over the coming sessions.