 English
  Русский
 Bahasa Indonesia
 Bahasa Malay
 ไทย
ไทย Español
 Deutsch
 Български
 Français
 Tiếng Việt
 中文
中文 বাংলা
বাংলা हिन्दी
 Čeština
 Українська
 Română

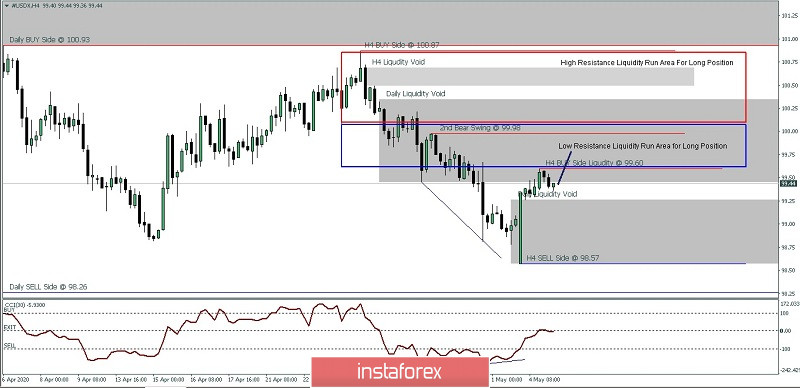
If we look at the 4-hour chart for #USDX, we see the divergence between the CCI (30) and the price. Based on this technical indicator, the odds are that the USD index is going to raid the nearest liquidity pool at 99.60 and will fill the liquidity void. The next BUY Stop of the liquidity pool will be at 99.98 too as long as #USDX does not retrace downwards below the 98.57 level.
(Disclaimer)