 English
  Русский
 Bahasa Indonesia
 Bahasa Malay
 ไทย
ไทย Español
 Deutsch
 Български
 Français
 Tiếng Việt
 中文
中文 বাংলা
বাংলা हिन्दी
 Čeština
 Українська
 Română

USDJPY has been in a downward sloping trend since mid March when it topped around 111.50. Since then price has been moving lower and today we are going to focus on the bullish wedge pattern that is being formed.
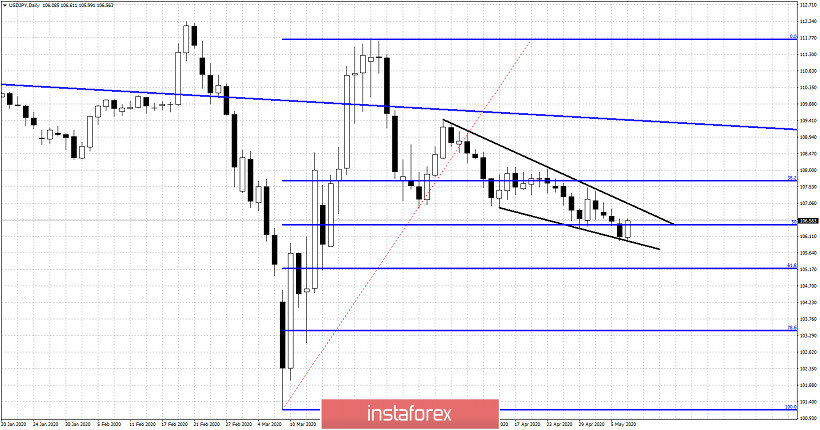
USDJPY has so far retraced 50% of the entire rise from 101.18 to 111.71. Price is moving inside the black wedge pattern. Price is now bouncing off the lower wedge pattern boundary. A daily close above 106.65 and we will talk about more bullish signals as the candlestick will have formed a bullish engulfing pattern.If this is the case I would then expect price to push towards the upper wedge boundary tomorrow. Resistance is at 107 area. A break above it will increase dramatically the chances of a major low.