EURUSD price bounced strongly today towards important cloud resistance and got rejected. Although we talked about the possibilities of a bounce in previous posts, we also noted the importance of resistance in the area of 1.0870.
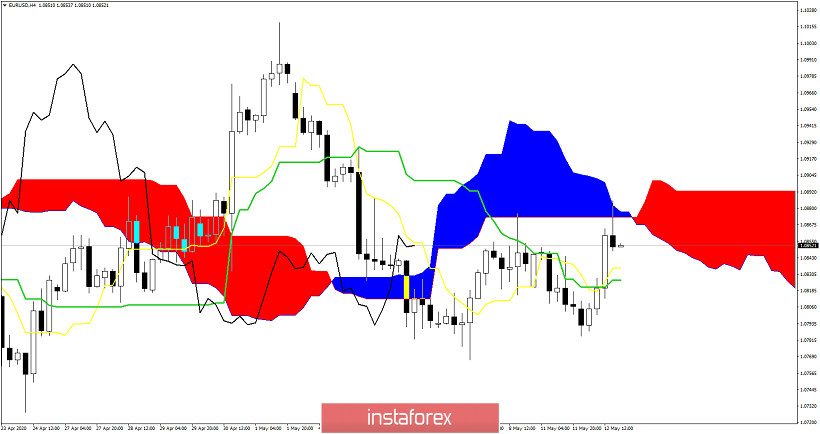
Price is approaching the 4 hour Kumo for the second time. So far we see another rejection as the first time. Price is still below the Kumo. All these signs are bearish. Unless price breaks above 1.09, EURUSD is vulnerable to another move towards 1.08 and lower. Support is key at 1.0784. Breaking below this support will open the way for a move towards 1.07-1.06. In our last analysis we mentioned a Fibonacci retracement target. The target of 1.0920 could not be reached. The 4 hour candlestick tried to break the 38% Fibonacci retracement but sharply reversed back below it.
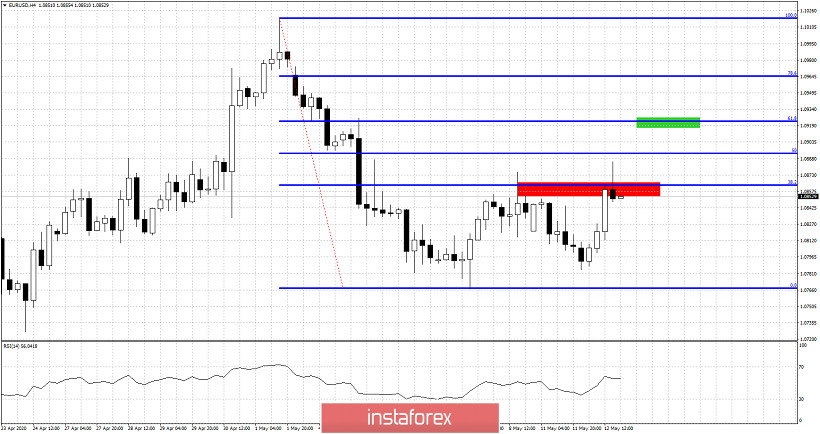
Red rectangle - resistance
Green rectangle - target if red rectangle is broken
The previous 4 hour candlestick is a shooting star bearish candlestick pattern. This view is confirmed by the bearish cloud rejection. Inability to break above the 38% Fibonacci retracement is a sign of weakness.
*The market analysis posted here is meant to increase your awareness, but not to give instructions to make a trade
 English
  Русский
 Bahasa Indonesia
 Bahasa Malay
 ไทย
ไทย Español
 Deutsch
 Български
 Français
 Tiếng Việt
 中文
中文 বাংলা
বাংলা हिन्दी
 Čeština
 Українська
 Română
