 English
  Русский
 Bahasa Indonesia
 Bahasa Malay
 ไทย
ไทย Español
 Deutsch
 Български
 Français
 Tiếng Việt
 中文
中文 বাংলা
বাংলা हिन्दी
 Čeština
 Українська
 Română

Gold price is back above $1,700-$1,705. This is a sign of strength. However price remains trapped below important resistance trend line making price create lower highs. The Ichimoku cloud indicator so far supports the bullish continuation scenario.
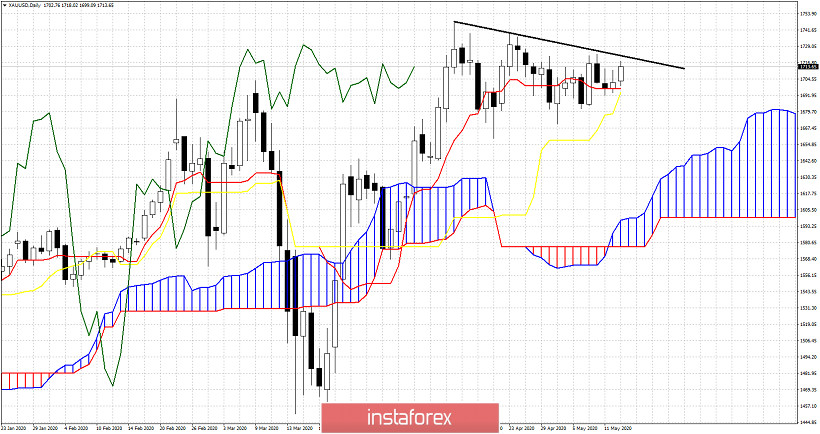
Gold price remains in a bullish trend in the Daily chart. Price is above both the tenkan-sen and the kijun-sen. Support is key at $1,690-95 area. As long as price is above this level trend is bullish. Breaking below this level will open the way for a move towards $1,630. Resistance as we mentioned in our previous analysis remains key at $1,720-25. Breaking above this level will push price to new 2020 highs.