 English
  Русский
 Bahasa Indonesia
 Bahasa Malay
 ไทย
ไทย Español
 Deutsch
 Български
 Français
 Tiếng Việt
 中文
中文 বাংলা
বাংলা हिन्दी
 Čeština
 Українська
 Română

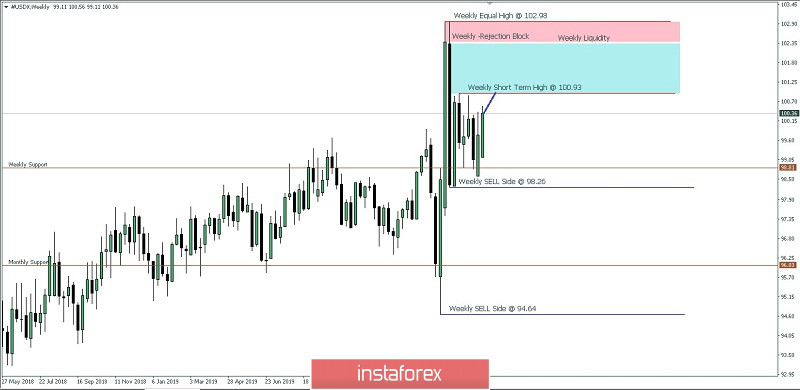
The US Dollar Index on the weekly chart is trying to go to the 100.93 - 100.98 levels as its nearest liquidity pool this week. This scenario will canceled if before reaching the 100.93, the US Dollar Index tumbles and close bellow the 99.46.
(Disclaimer)