 English
  Русский
 Bahasa Indonesia
 Bahasa Malay
 ไทย
ไทย Español
 Deutsch
 Български
 Français
 Tiếng Việt
 中文
中文 বাংলা
বাংলা हिन्दी
 Čeština
 Українська
 Română

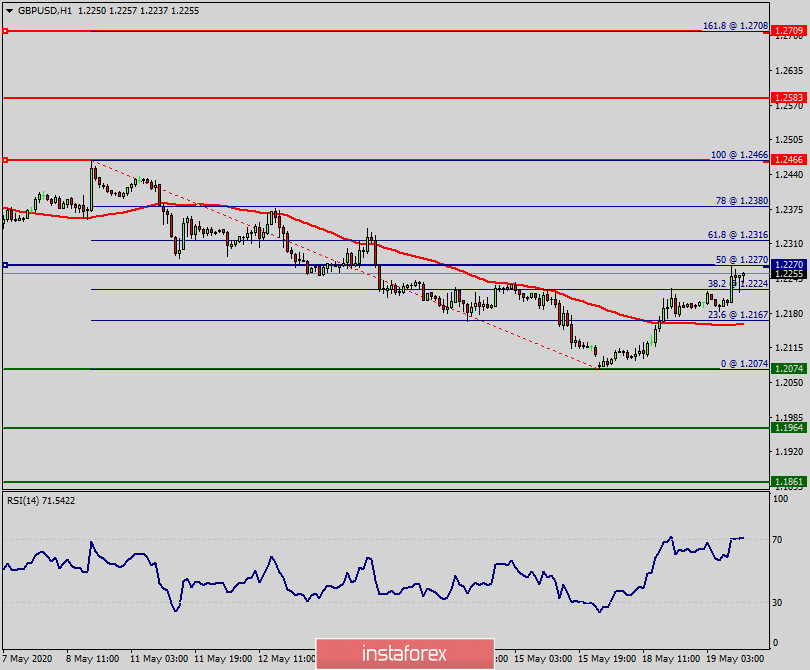
Overview:
The GBP/USD pair continues to move downwards from the level of 1.2270. The pair dropped from the level of 1.2270 to the bottom around 1.2074. But the pair has rebounded from the bottom of 1.2074 to back at 1.2270.
Today, the first support level is seen at 1.2074, the price is moving in a bearish channel now. Furthermore, the price has been set below the strong resistance at the level of 1.2270, which coincides with the 50% Fibonacci retracement level.
This resistance has been rejected several times confirming the veracity of a downtrend. Additionally, the RSI starts signaling a downward trend.
As a result, if the GBP/USD pair is able to break out the first support at 1.2200, the market will decline further to 1.2074 in order to test the weekly support 2. Consequently, the market is likely to show signs of a bearish trend.
So, it will be good to sell below the level of 1.2270 with the first target at 1.2200 and further to 1.2074.
However, stop loss is to be placed above the level of 1.7303.