 English
  Русский
 Bahasa Indonesia
 Bahasa Malay
 ไทย
ไทย Español
 Deutsch
 Български
 Français
 Tiếng Việt
 中文
中文 বাংলা
বাংলা हिन्दी
 Čeština
 Українська
 Română

Gold price remains in a bullish trend. Price continues to respect and trade above short-term support Ichimoku indicators. Although technically we still observe bearish divergence signals in the weekly chart, there is no reversal signal yet.
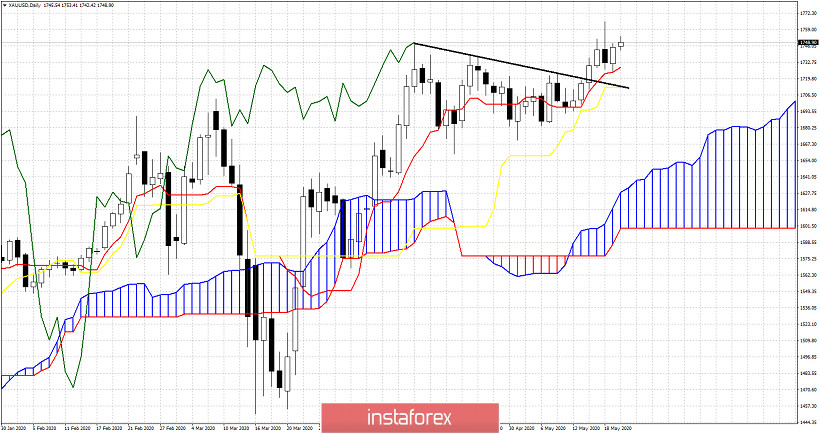
Gold price after breaking above the black resistance trend line has provided a new 2020 high and continues to hold above the tenkan-sen and kijun-sen indicators. Support by those two indicators has now risen towards $1,728 and $1,712 respectively. As long as price is above these two levels short-term trend remains bullish targeting $1,770-80 as we explained in previous posts.
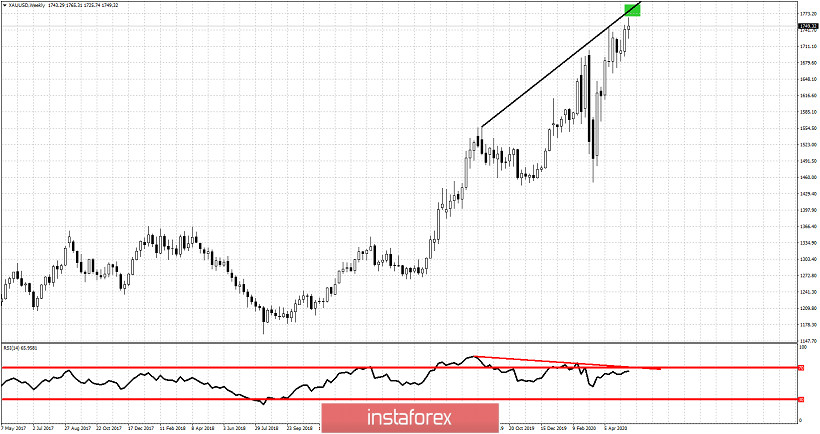
Red line -bearish divergence
Green rectangle -target
Gold price is diverging on a weekly basis. This is an important warning not to get too optimistic at $1,750 and above. Yes price could reach $1,780 but the downside potential is bigger. Key reversal level is the $1,700 base and the $1,710-20 support area. Looking closely for any clues of a reversal. So far no sign. Bulls need to be cautious.