 English
  Русский
 Bahasa Indonesia
 Bahasa Malay
 ไทย
ไทย Español
 Deutsch
 Български
 Français
 Tiếng Việt
 中文
中文 বাংলা
বাংলা हिन्दी
 Čeština
 Українська
 Română

USDCAD since mid March has been making lower highs starting from 1.4343, while the last lower high is at 1.4141. At the same time price is pulling back towards 1.3850 and so far we have seen 3 lows in the same price area.
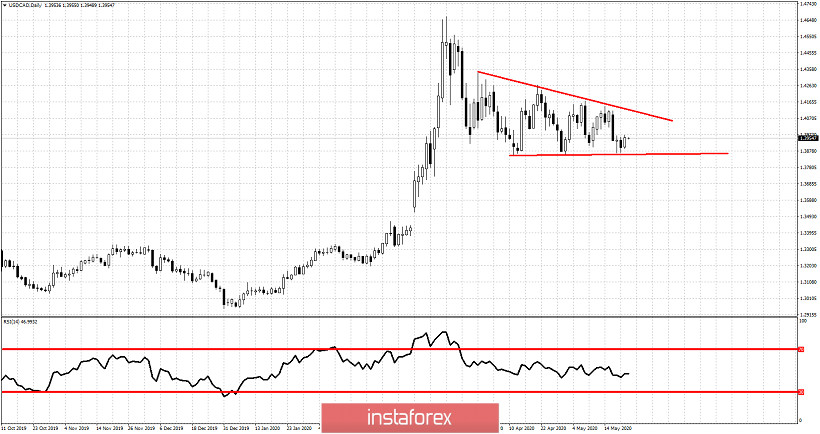
USDCAD has formed what we call a descending triangle pattern. Price so far respects support and this increases the chances for another bounce towards the upper triangle boundary. Usually this kind of formations break to the downside, but unless we see a clear break down of 1.3850 we should not ignore bulls. Key resistance is at 1.4120.