 English
  Русский
 Bahasa Indonesia
 Bahasa Malay
 ไทย
ไทย Español
 Deutsch
 Български
 Français
 Tiếng Việt
 中文
中文 বাংলা
বাংলা हिन्दी
 Čeština
 Українська
 Română

USDJPY has recently provided us with a bullish signal by breaking above the downward sloping wedge pattern. Price pulled back to form a higher low but price has not moved much higher, stabilizing around key short-term horizontal resistance.
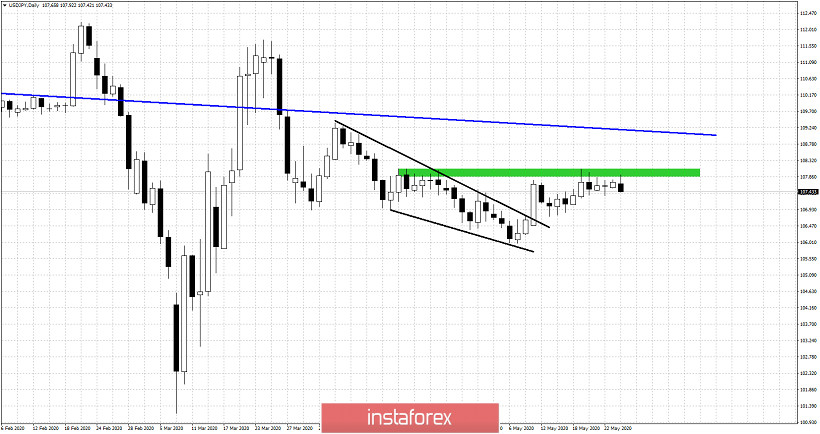
Green rectangle - horizontal resistance
Blue line - long-term resistance trend line
USDJPY has been moving mostly sideways during the last few sessions. Price has reached horizontal resistance at 107.90-108.05. So far price respects resistance and bulls are not strong enough to break higher. A rejection here does not cancel the bullish break out above the wedge pattern but delaying the move higher for more time, is not a good sign for bulls. Support is at 106.70 and next and most important at 106. Bulls need to respect these two levels. Otherwise they will be in trouble. A bullish signal will be given on a break above 108.10.